Putnam Large Cap Value Y (PEIYX)
Nasdaq - Nasdaq Delayed Price. Currency in USD
Add to watchlist
At close: 08:01PM EDT
Putnam Large Cap Value Y
Boston MA 02109
One Post Office Sq Mailstop A 14
Putnam Equity Income Fund
Management Information
Lauren B. DeMore,Lead Manager since August 30, 2019
Lauren DeMore, CFA, Portfolio Manager, has served as portfolio manager since 2019 and joined Putnam in 2006 and has been in the investment industry since 2002.
Previously at Putnam, Ms. DeMore was an Analyst covering the non-U.S. financials, telecommunications, and utilities sectors. Prior to joining Putnam, Ms. DeMore was an Analyst at EnCapital from 2002 to 2006.
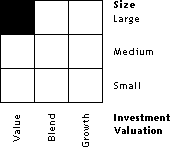
Morningstar Style Box
Yahoo partners with Morningstar a leading market research and investment data group to help investors rate and compare funds on Yahoo Finance. The Morningstar Category is shown next to the Morningstar Style Box which identifies a fund's investment focus, based on the underlying securities in the fund.
Morningstar Category
While the investment objective stated in a fund's prospectus may or may not reflect how the fund actually invests, the Morningstar category is assigned based on the underlying securities in each portfolio. Morningstar categories help investors and investment professionals make meaningful comparisons between funds. The categories make it easier to build well-diversified portfolios, assess potential risk, and identify top-performing funds. We place funds in a given category based on their portfolio statistics and compositions over the past three years. If the fund is new and has no portfolio history, we estimate where it will fall before giving it a more permanent category assignment. When necessary, we may change a category assignment based on recent changes to the portfolio.
Fund Overview
CategoryLarge Value
Fund FamilyFranklin Templeton Investments
Net Assets26.53B
YTD Return9.76%
Yield1.48%
Morningstar Rating★★★★★
Inception DateJan 31, 1999
Fund Operations
Last Dividend0.11
Last Cap Gain24.00
Holdings Turnover12.00%
Average for CategoryN/A
Fees & Expenses
ExpensePEIYXCategory Average
Annual Report Expense Ratio (net)1.65%0.94%
Prospectus Net Expense Ratio1.65%N/A
Prospectus Gross Expense Ratio1.65%N/A
Max 12b1 FeeN/AN/A
Max Front End Sales LoadN/A5.24%
Max Deferred Sales LoadN/A1.29%
3 Yr Expense Projection0N/A
5 Yr Expense Projection0N/A
10 Yr Expense Projection0N/A
© 2024 Yahoo. All rights reserved.