DaCheng HX XS 1-Y Intvl Alloc (0P0001N4UT.SZ)
Shenzhen - Shenzhen Delayed Price. Currency in CNY
Add to watchlist
At close: 04:00AM CST
DaCheng HX XS 1-Y Intvl Alloc
5F, 27-33F, Dacheng Fund HQ Bd, No. 1236, Haidesandao, Nanshan Dist, SZ
400-888-5558
Management Information
,Lead Manager since October 12, 2021
金融投资硕士。2005年5月至2009年5月任安永华明会计师事务所审计部高级审计师。2009年6月至2013年1月任第一创业证券研究所研究员、资产管理部信评分析岗。2013年2月至2015年12月任创金合信基金管理有限公司固定收益部投资主办。2016年1月至2017年10月任招商银行股份有限公司私人银行部投研岗。2017年11月加入大成基金管理有限公司,现任固定收益总部基金经理。具有基金从业资格。
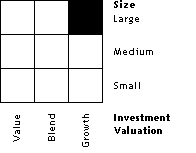
Morningstar Style Box
Yahoo partners with Morningstar a leading market research and investment data group to help investors rate and compare funds on Yahoo Finance. The Morningstar Category is shown next to the Morningstar Style Box which identifies a fund's investment focus, based on the underlying securities in the fund.

Morningstar Category
While the investment objective stated in a fund's prospectus may or may not reflect how the fund actually invests, the Morningstar category is assigned based on the underlying securities in each portfolio. Morningstar categories help investors and investment professionals make meaningful comparisons between funds. The categories make it easier to build well-diversified portfolios, assess potential risk, and identify top-performing funds. We place funds in a given category based on their portfolio statistics and compositions over the past three years. If the fund is new and has no portfolio history, we estimate where it will fall before giving it a more permanent category assignment. When necessary, we may change a category assignment based on recent changes to the portfolio.
Fund Overview
CategoryN/A
Fund FamilyDa Cheng Fund Mgmt Co.,Ltd
Net Assets68.19M
YTD Return0.52%
Yield0.00%
Morningstar RatingN/A1
Inception DateOct 12, 2021
Fund Operations
Last DividendN/A
Last Cap GainN/A
Holdings Turnover50.89%
Average for CategoryN/A
Fees & Expenses
Expense0P0001N4UT.SZCategory Average
Annual Report Expense Ratio (net)0.00%N/A
Prospectus Net Expense Ratio0.00%N/A
Prospectus Gross Expense Ratio0.00%N/A
Max 12b1 FeeN/AN/A
Max Front End Sales LoadN/AN/A
Max Deferred Sales LoadN/AN/A
3 Yr Expense Projection0N/A
5 Yr Expense Projection0N/A
10 Yr Expense Projection0N/A