
 Yahoo Finance
 Vodafone Group PLC's Dividend Analysis
Exploring the Sustainability and Performance of Vodafone's Dividends
Vodafone Group PLC (NASDAQ:VOD) recently announced a dividend of $0.49 per share, payable on 2024-08-02, with the ex-dividend date set for 2024-06-07. As investors look forward to this upcoming payment, the spotlight also shines on the company's dividend history, yield, and growth rates. Using the data from GuruFocus, let's delve into Vodafone Group PLC's dividend performance and evaluate its sustainability.
What Does Vodafone Group PLC Do?
This Powerful Chart Made Peter Lynch 29% A Year For 13 Years
How to calculate the intrinsic value of a stock?
Vodafone operates mobile and fixed-line networks and businesses in more than 20 countries. Its largest market is Germany, where it is the second mobile operator after Deutsche Telekom and owns a cable network after acquiring Kabel Deutschland in 2013 and Liberty Global Germany in 2019. In the UK, it acts mainly as a mobile operator, being the second largest player after BT Group. In 2024, Vodafone divested its Spanish and Italian divisions, given their low returns on invested capital.
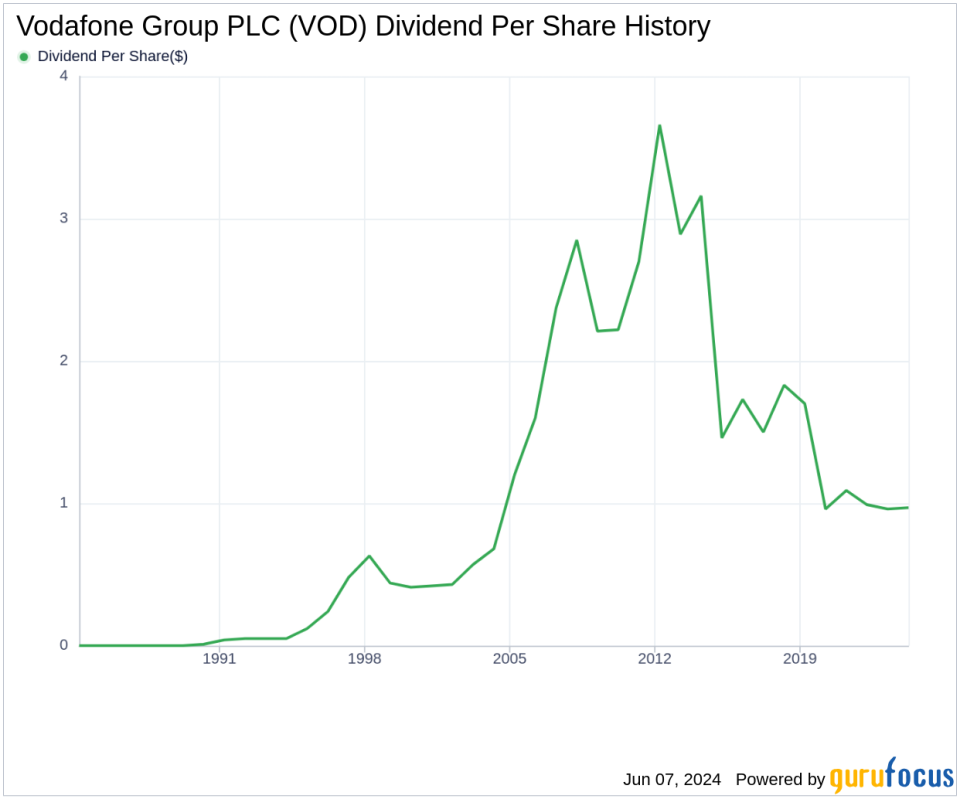
A Glimpse at Vodafone Group PLC's Dividend History
Vodafone Group PLC has maintained a consistent dividend payment record since 1989. Dividends are currently distributed on a bi-annual basis. Below is a chart showing annual Dividends Per Share for tracking historical trends.
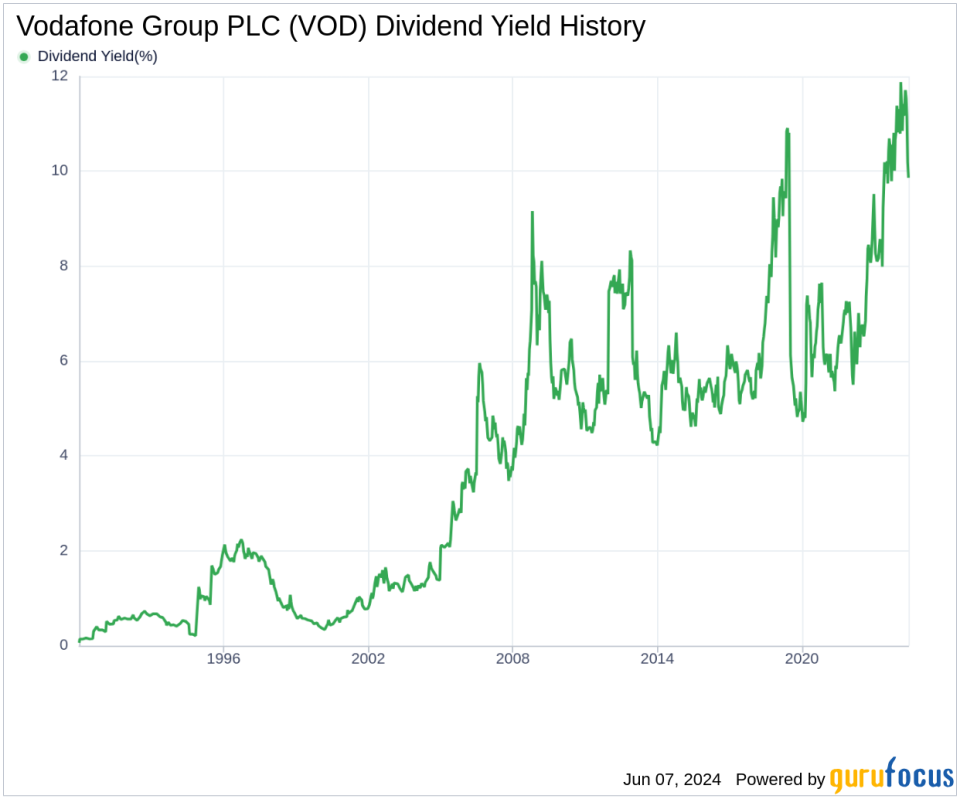
Breaking Down Vodafone Group PLC's Dividend Yield and Growth
As of today, Vodafone Group PLC currently has a 12-month trailing dividend yield of 10.08% and a 12-month forward dividend yield of 10.05%. This suggests an expectation of decreased dividend payments over the next 12 months. Extended to a five-year horizon, this rate decreased to -7.10% per year. And over the past decade, Vodafone Group PLC's annual dividends per share growth rate stands at -7.30%.
Based on Vodafone Group PLC's dividend yield and five-year growth rate, the 5-year yield on cost of Vodafone Group PLC stock as of today is approximately 6.97%.
The Sustainability Question: Payout Ratio and Profitability
To assess the sustainability of the dividend, one needs to evaluate the company's payout ratio. The dividend payout ratio provides insights into the portion of earnings the company distributes as dividends. A lower ratio suggests that the company retains a significant part of its earnings, thereby ensuring the availability of funds for future growth and unexpected downturns. As of 2024-03-31, Vodafone Group PLC's dividend payout ratio is 1.96, which may suggest that the company's dividend may not be sustainable.
Vodafone Group PLC's profitability rank, offers an understanding of the company's earnings prowess relative to its peers. GuruFocus ranks Vodafone Group PLC's profitability 6 out of 10 as of 2024-03-31, suggesting fair profitability. The company has reported net profit in 6 years out of the past 10 years.
Growth Metrics: The Future Outlook
To ensure the sustainability of dividends, a company must have robust growth metrics. Vodafone Group PLC's growth rank of 6 out of 10 suggests that the company has a fair growth outlook. Revenue is the lifeblood of any company, and Vodafone Group PLC's revenue per share, combined with the 3-year revenue growth rate, indicates a strong revenue model. Vodafone Group PLC's revenue has decreased by approximately -3.00% per year on average, a rate that underperforms approximately 77.75% of global competitors.
Next Steps
Considering Vodafone Group PLC's dividend payments, growth rate, payout ratio, profitability, and growth metrics, investors should weigh these factors carefully. While the high yield is attractive, the sustainability of dividends given the financial metrics presents a complex picture. For those interested in exploring further, GuruFocus Premium users can screen for high-dividend yield stocks using the High Dividend Yield Screener.
This article, generated by GuruFocus, is designed to provide general insights and is not tailored financial advice. Our commentary is rooted in historical data and analyst projections, utilizing an impartial methodology, and is not intended to serve as specific investment guidance. It does not formulate a recommendation to purchase or divest any stock and does not consider individual investment objectives or financial circumstances. Our objective is to deliver long-term, fundamental data-driven analysis. Be aware that our analysis might not incorporate the most recent, price-sensitive company announcements or qualitative information. GuruFocus holds no position in the stocks mentioned herein.
This article first appeared on GuruFocus.
