
 Yahoo Finance
 We Like These Underlying Return On Capital Trends At Lucero Energy (CVE:LOU)
If we want to find a potential multi-bagger, often there are underlying trends that can provide clues. Firstly, we'll want to see a proven return on capital employed (ROCE) that is increasing, and secondly, an expanding base of capital employed. Put simply, these types of businesses are compounding machines, meaning they are continually reinvesting their earnings at ever-higher rates of return. With that in mind, we've noticed some promising trends at Lucero Energy (CVE:LOU) so let's look a bit deeper.
What Is Return On Capital Employed (ROCE)?
Just to clarify if you're unsure, ROCE is a metric for evaluating how much pre-tax income (in percentage terms) a company earns on the capital invested in its business. To calculate this metric for Lucero Energy, this is the formula:
Return on Capital Employed = Earnings Before Interest and Tax (EBIT) ÷ (Total Assets - Current Liabilities)
0.15 = CA$84m ÷ (CA$592m - CA$32m) (Based on the trailing twelve months to December 2023).
So, Lucero Energy has an ROCE of 15%. In absolute terms, that's a satisfactory return, but compared to the Oil and Gas industry average of 9.0% it's much better.
See our latest analysis for Lucero Energy
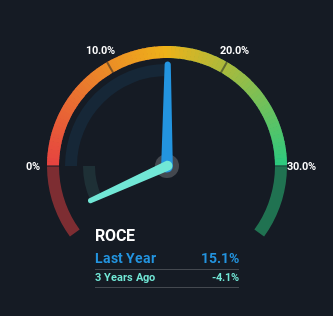
Above you can see how the current ROCE for Lucero Energy compares to its prior returns on capital, but there's only so much you can tell from the past. If you'd like, you can check out the forecasts from the analysts covering Lucero Energy for free.
So How Is Lucero Energy's ROCE Trending?
Lucero Energy is displaying some positive trends. The numbers show that in the last five years, the returns generated on capital employed have grown considerably to 15%. Basically the business is earning more per dollar of capital invested and in addition to that, 56% more capital is being employed now too. The increasing returns on a growing amount of capital is common amongst multi-baggers and that's why we're impressed.
In Conclusion...
All in all, it's terrific to see that Lucero Energy is reaping the rewards from prior investments and is growing its capital base. And since the stock has fallen 43% over the last five years, there might be an opportunity here. With that in mind, we believe the promising trends warrant this stock for further investigation.
Before jumping to any conclusions though, we need to know what value we're getting for the current share price. That's where you can check out our FREE intrinsic value estimation for LOU that compares the share price and estimated value.
For those who like to invest in solid companies, check out this free list of companies with solid balance sheets and high returns on equity.
Have feedback on this article? Concerned about the content? Get in touch with us directly. Alternatively, email editorial-team (at) simplywallst.com.
This article by Simply Wall St is general in nature. We provide commentary based on historical data and analyst forecasts only using an unbiased methodology and our articles are not intended to be financial advice. It does not constitute a recommendation to buy or sell any stock, and does not take account of your objectives, or your financial situation. We aim to bring you long-term focused analysis driven by fundamental data. Note that our analysis may not factor in the latest price-sensitive company announcements or qualitative material. Simply Wall St has no position in any stocks mentioned.
