
 Yahoo Finance
 Trupanion (NASDAQ:TRUP) shareholders have endured a 66% loss from investing in the stock three years ago
Trupanion, Inc. (NASDAQ:TRUP) shareholders should be happy to see the share price up 26% in the last month. But that doesn't change the fact that the returns over the last three years have been disappointing. Indeed, the share price is down a tragic 66% in the last three years. So it is really good to see an improvement. While many would remain nervous, there could be further gains if the business can put its best foot forward.
Since shareholders are down over the longer term, lets look at the underlying fundamentals over the that time and see if they've been consistent with returns.
Check out our latest analysis for Trupanion
Given that Trupanion didn't make a profit in the last twelve months, we'll focus on revenue growth to form a quick view of its business development. When a company doesn't make profits, we'd generally hope to see good revenue growth. That's because fast revenue growth can be easily extrapolated to forecast profits, often of considerable size.
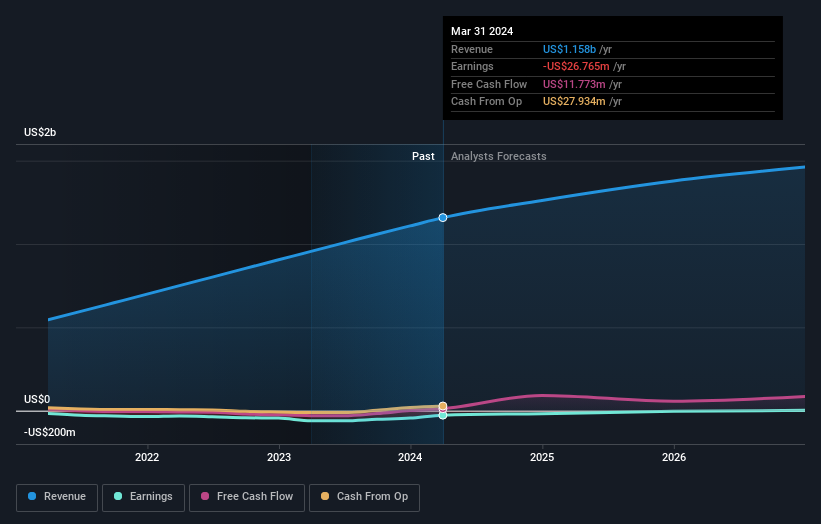
Over three years, Trupanion grew revenue at 24% per year. That's well above most other pre-profit companies. In contrast, the share price is down 18% compound, over three years - disappointing by most standards. This could mean hype has come out of the stock because the losses are concerning investors. When we see revenue growth, paired with a falling share price, we can't help wonder if there is an opportunity for those who are willing to dig deeper.
The graphic below depicts how earnings and revenue have changed over time (unveil the exact values by clicking on the image).
It's probably worth noting we've seen significant insider buying in the last quarter, which we consider a positive. That said, we think earnings and revenue growth trends are even more important factors to consider. You can see what analysts are predicting for Trupanion in this interactive graph of future profit estimates.
A Different Perspective
We're pleased to report that Trupanion shareholders have received a total shareholder return of 30% over one year. Notably the five-year annualised TSR loss of 1.5% per year compares very unfavourably with the recent share price performance. This makes us a little wary, but the business might have turned around its fortunes. I find it very interesting to look at share price over the long term as a proxy for business performance. But to truly gain insight, we need to consider other information, too. Consider risks, for instance. Every company has them, and we've spotted 1 warning sign for Trupanion you should know about.
If you like to buy stocks alongside management, then you might just love this free list of companies. (Hint: most of them are flying under the radar).
Please note, the market returns quoted in this article reflect the market weighted average returns of stocks that currently trade on American exchanges.
Have feedback on this article? Concerned about the content? Get in touch with us directly. Alternatively, email editorial-team (at) simplywallst.com.
This article by Simply Wall St is general in nature. We provide commentary based on historical data and analyst forecasts only using an unbiased methodology and our articles are not intended to be financial advice. It does not constitute a recommendation to buy or sell any stock, and does not take account of your objectives, or your financial situation. We aim to bring you long-term focused analysis driven by fundamental data. Note that our analysis may not factor in the latest price-sensitive company announcements or qualitative material. Simply Wall St has no position in any stocks mentioned.
