
 Yahoo Finance
 Tissue Regenix Group (LON:TRX) shareholders have endured a 80% loss from investing in the stock five years ago
Long term investing works well, but it doesn't always work for each individual stock. We don't wish catastrophic capital loss on anyone. Anyone who held Tissue Regenix Group plc (LON:TRX) for five years would be nursing their metaphorical wounds since the share price dropped 80% in that time. We really feel for shareholders in this scenario. It's a good reminder of the importance of diversification, and it's worth keeping in mind there's more to life than money, anyway.
Since shareholders are down over the longer term, lets look at the underlying fundamentals over the that time and see if they've been consistent with returns.
View our latest analysis for Tissue Regenix Group
Tissue Regenix Group isn't currently profitable, so most analysts would look to revenue growth to get an idea of how fast the underlying business is growing. Shareholders of unprofitable companies usually desire strong revenue growth. That's because fast revenue growth can be easily extrapolated to forecast profits, often of considerable size.
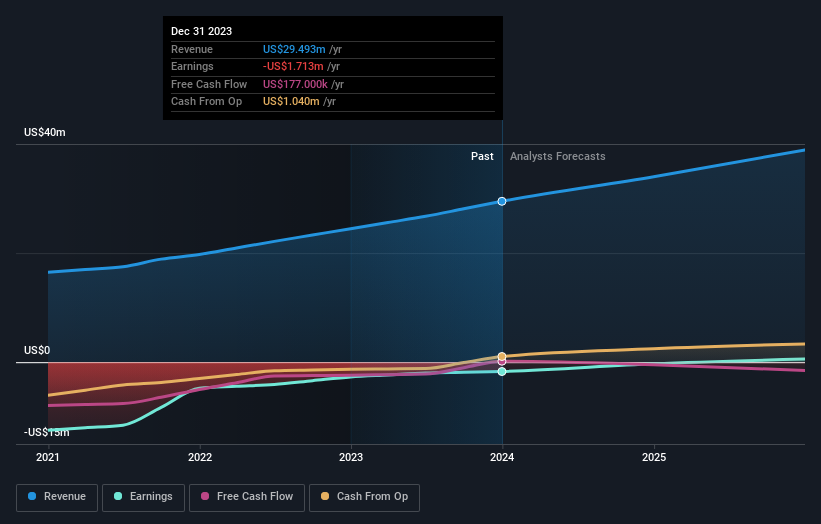
Over five years, Tissue Regenix Group grew its revenue at 14% per year. That's a pretty good rate for a long time period. So the stock price fall of 13% per year seems pretty steep. The market can be a harsh master when your company is losing money and revenue growth disappoints.
You can see below how earnings and revenue have changed over time (discover the exact values by clicking on the image).
You can see how its balance sheet has strengthened (or weakened) over time in this free interactive graphic.
A Different Perspective
It's nice to see that Tissue Regenix Group shareholders have received a total shareholder return of 30% over the last year. Notably the five-year annualised TSR loss of 13% per year compares very unfavourably with the recent share price performance. This makes us a little wary, but the business might have turned around its fortunes. It's always interesting to track share price performance over the longer term. But to understand Tissue Regenix Group better, we need to consider many other factors. Even so, be aware that Tissue Regenix Group is showing 1 warning sign in our investment analysis , you should know about...
If you like to buy stocks alongside management, then you might just love this free list of companies. (Hint: many of them are unnoticed AND have attractive valuation).
Please note, the market returns quoted in this article reflect the market weighted average returns of stocks that currently trade on British exchanges.
Have feedback on this article? Concerned about the content? Get in touch with us directly. Alternatively, email editorial-team (at) simplywallst.com.
This article by Simply Wall St is general in nature. We provide commentary based on historical data and analyst forecasts only using an unbiased methodology and our articles are not intended to be financial advice. It does not constitute a recommendation to buy or sell any stock, and does not take account of your objectives, or your financial situation. We aim to bring you long-term focused analysis driven by fundamental data. Note that our analysis may not factor in the latest price-sensitive company announcements or qualitative material. Simply Wall St has no position in any stocks mentioned.
Have feedback on this article? Concerned about the content? Get in touch with us directly. Alternatively, email editorial-team@simplywallst.com
