
 Yahoo Finance
 Those who invested in Morningstar (NASDAQ:MORN) five years ago are up 129%
The worst result, after buying shares in a company (assuming no leverage), would be if you lose all the money you put in. But on a lighter note, a good company can see its share price rise well over 100%. Long term Morningstar, Inc. (NASDAQ:MORN) shareholders would be well aware of this, since the stock is up 122% in five years. It's also good to see the share price up 10% over the last quarter. But this could be related to the strong market, which is up 6.6% in the last three months.
So let's investigate and see if the longer term performance of the company has been in line with the underlying business' progress.
See our latest analysis for Morningstar
While markets are a powerful pricing mechanism, share prices reflect investor sentiment, not just underlying business performance. One flawed but reasonable way to assess how sentiment around a company has changed is to compare the earnings per share (EPS) with the share price.
Over half a decade, Morningstar managed to grow its earnings per share at 4.0% a year. This EPS growth is lower than the 17% average annual increase in the share price. This suggests that market participants hold the company in higher regard, these days. And that's hardly shocking given the track record of growth. This optimism is visible in its fairly high P/E ratio of 60.24.
You can see below how EPS has changed over time (discover the exact values by clicking on the image).
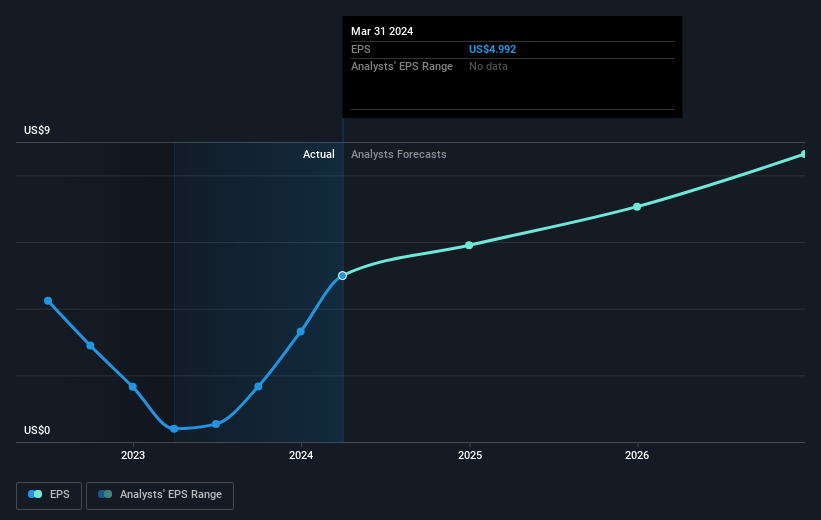
It's probably worth noting that the CEO is paid less than the median at similar sized companies. But while CEO remuneration is always worth checking, the really important question is whether the company can grow earnings going forward. It might be well worthwhile taking a look at our free report on Morningstar's earnings, revenue and cash flow.
What About Dividends?
As well as measuring the share price return, investors should also consider the total shareholder return (TSR). The TSR incorporates the value of any spin-offs or discounted capital raisings, along with any dividends, based on the assumption that the dividends are reinvested. So for companies that pay a generous dividend, the TSR is often a lot higher than the share price return. In the case of Morningstar, it has a TSR of 129% for the last 5 years. That exceeds its share price return that we previously mentioned. This is largely a result of its dividend payments!
A Different Perspective
We're pleased to report that Morningstar shareholders have received a total shareholder return of 52% over one year. That's including the dividend. That's better than the annualised return of 18% over half a decade, implying that the company is doing better recently. Someone with an optimistic perspective could view the recent improvement in TSR as indicating that the business itself is getting better with time. If you would like to research Morningstar in more detail then you might want to take a look at whether insiders have been buying or selling shares in the company.
But note: Morningstar may not be the best stock to buy. So take a peek at this free list of interesting companies with past earnings growth (and further growth forecast).
Please note, the market returns quoted in this article reflect the market weighted average returns of stocks that currently trade on American exchanges.
Have feedback on this article? Concerned about the content? Get in touch with us directly. Alternatively, email editorial-team (at) simplywallst.com.
This article by Simply Wall St is general in nature. We provide commentary based on historical data and analyst forecasts only using an unbiased methodology and our articles are not intended to be financial advice. It does not constitute a recommendation to buy or sell any stock, and does not take account of your objectives, or your financial situation. We aim to bring you long-term focused analysis driven by fundamental data. Note that our analysis may not factor in the latest price-sensitive company announcements or qualitative material. Simply Wall St has no position in any stocks mentioned.
