
 Yahoo Finance
 Those who invested in B&M European Value Retail (LON:BME) five years ago are up 103%
Stock pickers are generally looking for stocks that will outperform the broader market. And the truth is, you can make significant gains if you buy good quality businesses at the right price. For example, long term B&M European Value Retail S.A. (LON:BME) shareholders have enjoyed a 35% share price rise over the last half decade, well in excess of the market return of around 6.9% (not including dividends). However, more recent returns haven't been as impressive as that, with the stock returning just 14% in the last year , including dividends .
So let's investigate and see if the longer term performance of the company has been in line with the underlying business' progress.
See our latest analysis for B&M European Value Retail
While the efficient markets hypothesis continues to be taught by some, it has been proven that markets are over-reactive dynamic systems, and investors are not always rational. One flawed but reasonable way to assess how sentiment around a company has changed is to compare the earnings per share (EPS) with the share price.
Over half a decade, B&M European Value Retail managed to grow its earnings per share at 11% a year. The EPS growth is more impressive than the yearly share price gain of 6% over the same period. So it seems the market isn't so enthusiastic about the stock these days.
You can see below how EPS has changed over time (discover the exact values by clicking on the image).
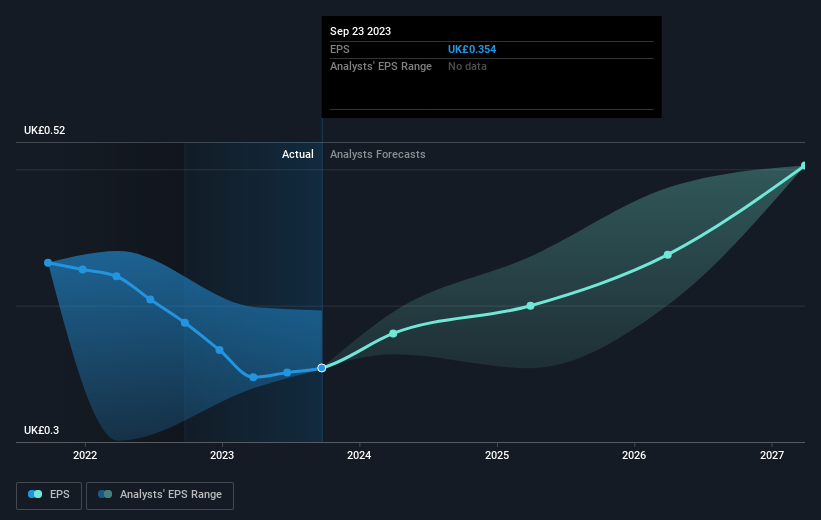
Before buying or selling a stock, we always recommend a close examination of historic growth trends, available here.
What About Dividends?
It is important to consider the total shareholder return, as well as the share price return, for any given stock. The TSR incorporates the value of any spin-offs or discounted capital raisings, along with any dividends, based on the assumption that the dividends are reinvested. So for companies that pay a generous dividend, the TSR is often a lot higher than the share price return. We note that for B&M European Value Retail the TSR over the last 5 years was 103%, which is better than the share price return mentioned above. And there's no prize for guessing that the dividend payments largely explain the divergence!
A Different Perspective
We're pleased to report that B&M European Value Retail shareholders have received a total shareholder return of 14% over one year. Of course, that includes the dividend. However, that falls short of the 15% TSR per annum it has made for shareholders, each year, over five years. I find it very interesting to look at share price over the long term as a proxy for business performance. But to truly gain insight, we need to consider other information, too. Case in point: We've spotted 2 warning signs for B&M European Value Retail you should be aware of.
If you like to buy stocks alongside management, then you might just love this free list of companies. (Hint: insiders have been buying them).
Please note, the market returns quoted in this article reflect the market weighted average returns of stocks that currently trade on British exchanges.
Have feedback on this article? Concerned about the content? Get in touch with us directly. Alternatively, email editorial-team (at) simplywallst.com.
This article by Simply Wall St is general in nature. We provide commentary based on historical data and analyst forecasts only using an unbiased methodology and our articles are not intended to be financial advice. It does not constitute a recommendation to buy or sell any stock, and does not take account of your objectives, or your financial situation. We aim to bring you long-term focused analysis driven by fundamental data. Note that our analysis may not factor in the latest price-sensitive company announcements or qualitative material. Simply Wall St has no position in any stocks mentioned.
