
 Yahoo Finance
 There's Been No Shortage Of Growth Recently For TRX Gold's (TSE:TRX) Returns On Capital
What trends should we look for it we want to identify stocks that can multiply in value over the long term? Firstly, we'd want to identify a growing return on capital employed (ROCE) and then alongside that, an ever-increasing base of capital employed. Put simply, these types of businesses are compounding machines, meaning they are continually reinvesting their earnings at ever-higher rates of return. With that in mind, we've noticed some promising trends at TRX Gold (TSE:TRX) so let's look a bit deeper.
Understanding Return On Capital Employed (ROCE)
For those who don't know, ROCE is a measure of a company's yearly pre-tax profit (its return), relative to the capital employed in the business. The formula for this calculation on TRX Gold is:
Return on Capital Employed = Earnings Before Interest and Tax (EBIT) ÷ (Total Assets - Current Liabilities)
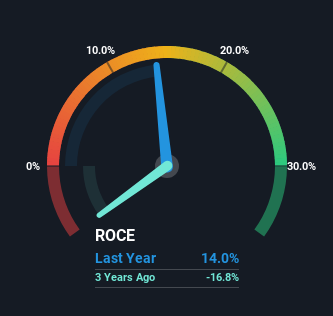
0.14 = US$9.9m ÷ (US$88m - US$17m) (Based on the trailing twelve months to February 2024).
Thus, TRX Gold has an ROCE of 14%. On its own, that's a standard return, however it's much better than the 1.6% generated by the Metals and Mining industry.
See our latest analysis for TRX Gold
Above you can see how the current ROCE for TRX Gold compares to its prior returns on capital, but there's only so much you can tell from the past. If you'd like to see what analysts are forecasting going forward, you should check out our free analyst report for TRX Gold .
What Can We Tell From TRX Gold's ROCE Trend?
We're delighted to see that TRX Gold is reaping rewards from its investments and is now generating some pre-tax profits. Shareholders would no doubt be pleased with this because the business was loss-making five years ago but is is now generating 14% on its capital. And unsurprisingly, like most companies trying to break into the black, TRX Gold is utilizing 121% more capital than it was five years ago. This can tell us that the company has plenty of reinvestment opportunities that are able to generate higher returns.
The Bottom Line On TRX Gold's ROCE
Long story short, we're delighted to see that TRX Gold's reinvestment activities have paid off and the company is now profitable. Astute investors may have an opportunity here because the stock has declined 34% in the last five years. That being the case, research into the company's current valuation metrics and future prospects seems fitting.
Before jumping to any conclusions though, we need to know what value we're getting for the current share price. That's where you can check out our FREE intrinsic value estimation for TRX that compares the share price and estimated value.
While TRX Gold may not currently earn the highest returns, we've compiled a list of companies that currently earn more than 25% return on equity. Check out this free list here.
Have feedback on this article? Concerned about the content? Get in touch with us directly. Alternatively, email editorial-team (at) simplywallst.com.
This article by Simply Wall St is general in nature. We provide commentary based on historical data and analyst forecasts only using an unbiased methodology and our articles are not intended to be financial advice. It does not constitute a recommendation to buy or sell any stock, and does not take account of your objectives, or your financial situation. We aim to bring you long-term focused analysis driven by fundamental data. Note that our analysis may not factor in the latest price-sensitive company announcements or qualitative material. Simply Wall St has no position in any stocks mentioned.
