
 Yahoo Finance
 Slowing Rates Of Return At Wilmar International (SGX:F34) Leave Little Room For Excitement
What trends should we look for it we want to identify stocks that can multiply in value over the long term? Firstly, we'd want to identify a growing return on capital employed (ROCE) and then alongside that, an ever-increasing base of capital employed. Ultimately, this demonstrates that it's a business that is reinvesting profits at increasing rates of return. However, after briefly looking over the numbers, we don't think Wilmar International (SGX:F34) has the makings of a multi-bagger going forward, but let's have a look at why that may be.
Return On Capital Employed (ROCE): What Is It?
If you haven't worked with ROCE before, it measures the 'return' (pre-tax profit) a company generates from capital employed in its business. Analysts use this formula to calculate it for Wilmar International:
Return on Capital Employed = Earnings Before Interest and Tax (EBIT) ÷ (Total Assets - Current Liabilities)
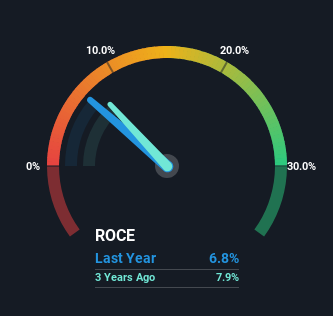
0.068 = US$2.2b ÷ (US$62b - US$30b) (Based on the trailing twelve months to December 2023).
Therefore, Wilmar International has an ROCE of 6.8%. In absolute terms, that's a low return but it's around the Food industry average of 7.6%.
Check out our latest analysis for Wilmar International
In the above chart we have measured Wilmar International's prior ROCE against its prior performance, but the future is arguably more important. If you'd like, you can check out the forecasts from the analysts covering Wilmar International for free.
What Does the ROCE Trend For Wilmar International Tell Us?
There are better returns on capital out there than what we're seeing at Wilmar International. The company has consistently earned 6.8% for the last five years, and the capital employed within the business has risen 41% in that time. This poor ROCE doesn't inspire confidence right now, and with the increase in capital employed, it's evident that the business isn't deploying the funds into high return investments.
On a side note, Wilmar International's current liabilities are still rather high at 48% of total assets. This effectively means that suppliers (or short-term creditors) are funding a large portion of the business, so just be aware that this can introduce some elements of risk. Ideally we'd like to see this reduce as that would mean fewer obligations bearing risks.
What We Can Learn From Wilmar International's ROCE
Long story short, while Wilmar International has been reinvesting its capital, the returns that it's generating haven't increased. Unsurprisingly, the stock has only gained 15% over the last five years, which potentially indicates that investors are accounting for this going forward. So if you're looking for a multi-bagger, the underlying trends indicate you may have better chances elsewhere.
If you'd like to know more about Wilmar International, we've spotted 3 warning signs, and 1 of them shouldn't be ignored.
For those who like to invest in solid companies, check out this free list of companies with solid balance sheets and high returns on equity.
Have feedback on this article? Concerned about the content? Get in touch with us directly. Alternatively, email editorial-team (at) simplywallst.com.
This article by Simply Wall St is general in nature. We provide commentary based on historical data and analyst forecasts only using an unbiased methodology and our articles are not intended to be financial advice. It does not constitute a recommendation to buy or sell any stock, and does not take account of your objectives, or your financial situation. We aim to bring you long-term focused analysis driven by fundamental data. Note that our analysis may not factor in the latest price-sensitive company announcements or qualitative material. Simply Wall St has no position in any stocks mentioned.
