
 Yahoo Finance
 Shareholders in Angi (NASDAQ:ANGI) have lost 87%, as stock drops 7.3% this past week
We're definitely into long term investing, but some companies are simply bad investments over any time frame. We really hate to see fellow investors lose their hard-earned money. Spare a thought for those who held Angi Inc. (NASDAQ:ANGI) for five whole years - as the share price tanked 87%. We also note that the stock has performed poorly over the last year, with the share price down 36%. Shareholders have had an even rougher run lately, with the share price down 23% in the last 90 days. We note that the company has reported results fairly recently; and the market is hardly delighted. You can check out the latest numbers in our company report. We really feel for shareholders in this scenario. It's a good reminder of the importance of diversification, and it's worth keeping in mind there's more to life than money, anyway.
Since Angi has shed US$80m from its value in the past 7 days, let's see if the longer term decline has been driven by the business' economics.
Check out our latest analysis for Angi
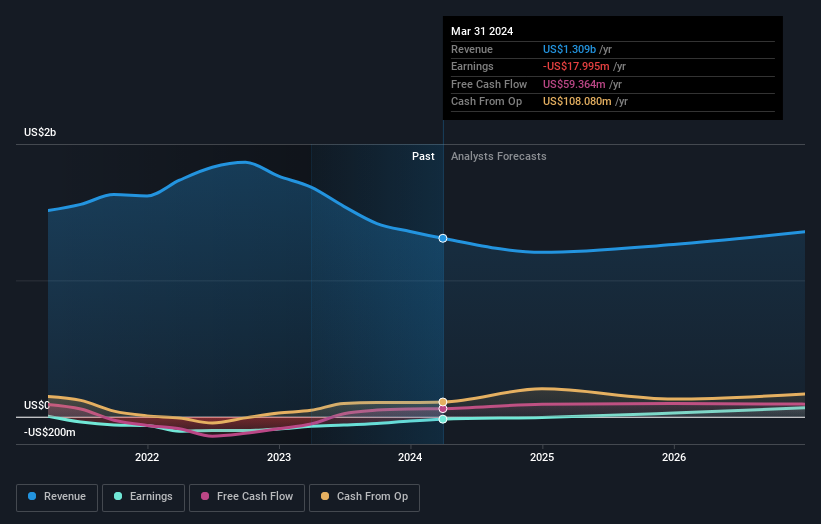
Angi isn't currently profitable, so most analysts would look to revenue growth to get an idea of how fast the underlying business is growing. When a company doesn't make profits, we'd generally hope to see good revenue growth. As you can imagine, fast revenue growth, when maintained, often leads to fast profit growth.
In the last half decade, Angi saw its revenue increase by 4.2% per year. That's not a very high growth rate considering it doesn't make profits. It's not so sure that share price crash of 13% per year is completely deserved, but the market is doubtless disappointed. We'd be pretty cautious about this one, although the sell-off may be too severe. A company like this generally needs to produce profits before it can find favour with new investors.
The image below shows how earnings and revenue have tracked over time (if you click on the image you can see greater detail).
You can see how its balance sheet has strengthened (or weakened) over time in this free interactive graphic.
A Different Perspective
Angi shareholders are down 36% for the year, but the market itself is up 25%. However, keep in mind that even the best stocks will sometimes underperform the market over a twelve month period. Unfortunately, last year's performance may indicate unresolved challenges, given that it was worse than the annualised loss of 13% over the last half decade. Generally speaking long term share price weakness can be a bad sign, though contrarian investors might want to research the stock in hope of a turnaround. You could get a better understanding of Angi's growth by checking out this more detailed historical graph of earnings, revenue and cash flow.
If you would prefer to check out another company -- one with potentially superior financials -- then do not miss this free list of companies that have proven they can grow earnings.
Please note, the market returns quoted in this article reflect the market weighted average returns of stocks that currently trade on American exchanges.
Have feedback on this article? Concerned about the content? Get in touch with us directly. Alternatively, email editorial-team (at) simplywallst.com.
This article by Simply Wall St is general in nature. We provide commentary based on historical data and analyst forecasts only using an unbiased methodology and our articles are not intended to be financial advice. It does not constitute a recommendation to buy or sell any stock, and does not take account of your objectives, or your financial situation. We aim to bring you long-term focused analysis driven by fundamental data. Note that our analysis may not factor in the latest price-sensitive company announcements or qualitative material. Simply Wall St has no position in any stocks mentioned.
