
 Yahoo Finance
 Returns At Spire Healthcare Group (LON:SPI) Are On The Way Up
Did you know there are some financial metrics that can provide clues of a potential multi-bagger? In a perfect world, we'd like to see a company investing more capital into its business and ideally the returns earned from that capital are also increasing. Put simply, these types of businesses are compounding machines, meaning they are continually reinvesting their earnings at ever-higher rates of return. So on that note, Spire Healthcare Group (LON:SPI) looks quite promising in regards to its trends of return on capital.
Understanding Return On Capital Employed (ROCE)
If you haven't worked with ROCE before, it measures the 'return' (pre-tax profit) a company generates from capital employed in its business. To calculate this metric for Spire Healthcare Group, this is the formula:
Return on Capital Employed = Earnings Before Interest and Tax (EBIT) ÷ (Total Assets - Current Liabilities)
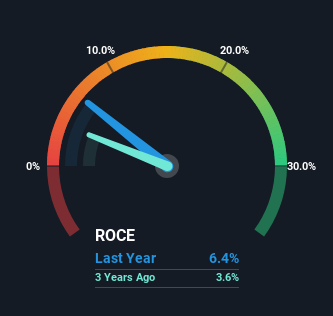
0.064 = UK£127m ÷ (UK£2.3b - UK£318m) (Based on the trailing twelve months to December 2023).
Thus, Spire Healthcare Group has an ROCE of 6.4%. Ultimately, that's a low return and it under-performs the Healthcare industry average of 8.5%.
View our latest analysis for Spire Healthcare Group
Above you can see how the current ROCE for Spire Healthcare Group compares to its prior returns on capital, but there's only so much you can tell from the past. If you'd like to see what analysts are forecasting going forward, you should check out our free analyst report for Spire Healthcare Group .
What Can We Tell From Spire Healthcare Group's ROCE Trend?
Spire Healthcare Group's ROCE growth is quite impressive. More specifically, while the company has kept capital employed relatively flat over the last five years, the ROCE has climbed 40% in that same time. Basically the business is generating higher returns from the same amount of capital and that is proof that there are improvements in the company's efficiencies. It's worth looking deeper into this though because while it's great that the business is more efficient, it might also mean that going forward the areas to invest internally for the organic growth are lacking.
The Bottom Line
To sum it up, Spire Healthcare Group is collecting higher returns from the same amount of capital, and that's impressive. And with the stock having performed exceptionally well over the last five years, these patterns are being accounted for by investors. So given the stock has proven it has promising trends, it's worth researching the company further to see if these trends are likely to persist.
Like most companies, Spire Healthcare Group does come with some risks, and we've found 1 warning sign that you should be aware of.
While Spire Healthcare Group may not currently earn the highest returns, we've compiled a list of companies that currently earn more than 25% return on equity. Check out this free list here.
Have feedback on this article? Concerned about the content? Get in touch with us directly. Alternatively, email editorial-team (at) simplywallst.com.
This article by Simply Wall St is general in nature. We provide commentary based on historical data and analyst forecasts only using an unbiased methodology and our articles are not intended to be financial advice. It does not constitute a recommendation to buy or sell any stock, and does not take account of your objectives, or your financial situation. We aim to bring you long-term focused analysis driven by fundamental data. Note that our analysis may not factor in the latest price-sensitive company announcements or qualitative material. Simply Wall St has no position in any stocks mentioned.
