
 Yahoo Finance
 Returns At Pediatrix Medical Group (NYSE:MD) Appear To Be Weighed Down
There are a few key trends to look for if we want to identify the next multi-bagger. Firstly, we'd want to identify a growing return on capital employed (ROCE) and then alongside that, an ever-increasing base of capital employed. If you see this, it typically means it's a company with a great business model and plenty of profitable reinvestment opportunities. Having said that, from a first glance at Pediatrix Medical Group (NYSE:MD) we aren't jumping out of our chairs at how returns are trending, but let's have a deeper look.
Understanding Return On Capital Employed (ROCE)
Just to clarify if you're unsure, ROCE is a metric for evaluating how much pre-tax income (in percentage terms) a company earns on the capital invested in its business. Analysts use this formula to calculate it for Pediatrix Medical Group:
Return on Capital Employed = Earnings Before Interest and Tax (EBIT) ÷ (Total Assets - Current Liabilities)
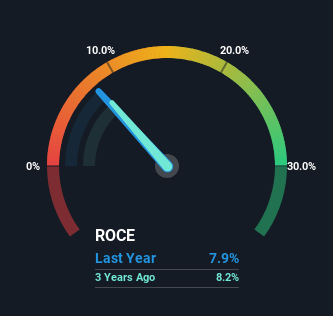
0.079 = US$152m ÷ (US$2.2b - US$247m) (Based on the trailing twelve months to March 2024).
So, Pediatrix Medical Group has an ROCE of 7.9%. Ultimately, that's a low return and it under-performs the Healthcare industry average of 11%.
View our latest analysis for Pediatrix Medical Group
In the above chart we have measured Pediatrix Medical Group's prior ROCE against its prior performance, but the future is arguably more important. If you're interested, you can view the analysts predictions in our free analyst report for Pediatrix Medical Group .
How Are Returns Trending?
We've noticed that although returns on capital are flat over the last five years, the amount of capital employed in the business has fallen 64% in that same period. When a company effectively decreases its assets base, it's not usually a sign to be optimistic on that company. Not only that, but the low returns on this capital mentioned earlier would leave most investors unimpressed.
Our Take On Pediatrix Medical Group's ROCE
In summary, Pediatrix Medical Group isn't reinvesting funds back into the business and returns aren't growing. It seems that investors have little hope of these trends getting any better and that may have partly contributed to the stock collapsing 71% in the last five years. Therefore based on the analysis done in this article, we don't think Pediatrix Medical Group has the makings of a multi-bagger.
One more thing, we've spotted 1 warning sign facing Pediatrix Medical Group that you might find interesting.
While Pediatrix Medical Group may not currently earn the highest returns, we've compiled a list of companies that currently earn more than 25% return on equity. Check out this free list here.
Have feedback on this article? Concerned about the content? Get in touch with us directly. Alternatively, email editorial-team (at) simplywallst.com.
This article by Simply Wall St is general in nature. We provide commentary based on historical data and analyst forecasts only using an unbiased methodology and our articles are not intended to be financial advice. It does not constitute a recommendation to buy or sell any stock, and does not take account of your objectives, or your financial situation. We aim to bring you long-term focused analysis driven by fundamental data. Note that our analysis may not factor in the latest price-sensitive company announcements or qualitative material. Simply Wall St has no position in any stocks mentioned.
