
 Yahoo Finance
 Return Trends At Turners Automotive Group (NZSE:TRA) Aren't Appealing
What trends should we look for it we want to identify stocks that can multiply in value over the long term? Firstly, we'll want to see a proven return on capital employed (ROCE) that is increasing, and secondly, an expanding base of capital employed. Ultimately, this demonstrates that it's a business that is reinvesting profits at increasing rates of return. However, after investigating Turners Automotive Group (NZSE:TRA), we don't think it's current trends fit the mold of a multi-bagger.
What Is Return On Capital Employed (ROCE)?
For those who don't know, ROCE is a measure of a company's yearly pre-tax profit (its return), relative to the capital employed in the business. The formula for this calculation on Turners Automotive Group is:
Return on Capital Employed = Earnings Before Interest and Tax (EBIT) ÷ (Total Assets - Current Liabilities)
0.068 = NZ$58m ÷ (NZ$866m - NZ$5.2m) (Based on the trailing twelve months to March 2024).
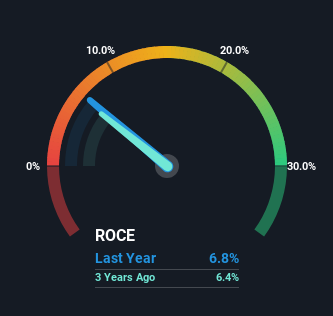
So, Turners Automotive Group has an ROCE of 6.8%. Ultimately, that's a low return and it under-performs the Specialty Retail industry average of 13%.
Check out our latest analysis for Turners Automotive Group
Above you can see how the current ROCE for Turners Automotive Group compares to its prior returns on capital, but there's only so much you can tell from the past. If you're interested, you can view the analysts predictions in our free analyst report for Turners Automotive Group .
What The Trend Of ROCE Can Tell Us
There are better returns on capital out there than what we're seeing at Turners Automotive Group. Over the past five years, ROCE has remained relatively flat at around 6.8% and the business has deployed 44% more capital into its operations. This poor ROCE doesn't inspire confidence right now, and with the increase in capital employed, it's evident that the business isn't deploying the funds into high return investments.
The Bottom Line
In conclusion, Turners Automotive Group has been investing more capital into the business, but returns on that capital haven't increased. Yet to long term shareholders the stock has gifted them an incredible 146% return in the last five years, so the market appears to be rosy about its future. Ultimately, if the underlying trends persist, we wouldn't hold our breath on it being a multi-bagger going forward.
Turners Automotive Group does come with some risks though, we found 3 warning signs in our investment analysis, and 1 of those is potentially serious...
While Turners Automotive Group may not currently earn the highest returns, we've compiled a list of companies that currently earn more than 25% return on equity. Check out this free list here.
Have feedback on this article? Concerned about the content? Get in touch with us directly. Alternatively, email editorial-team (at) simplywallst.com.
This article by Simply Wall St is general in nature. We provide commentary based on historical data and analyst forecasts only using an unbiased methodology and our articles are not intended to be financial advice. It does not constitute a recommendation to buy or sell any stock, and does not take account of your objectives, or your financial situation. We aim to bring you long-term focused analysis driven by fundamental data. Note that our analysis may not factor in the latest price-sensitive company announcements or qualitative material. Simply Wall St has no position in any stocks mentioned.
Have feedback on this article? Concerned about the content? Get in touch with us directly. Alternatively, email editorial-team@simplywallst.com
