Radian Group (RDN) Q1 Earnings Beat on Higher Premiums
Radian Group Inc. RDN reported first-quarter 2024 adjusted operating income of $1.03 per share, which beat the Zacks Consensus Estimate by 24%. The bottom line increased 5.1% year over year.
The results reflected improved persistency and a rise in premiums and insurance written, partially offset by higher expenses.
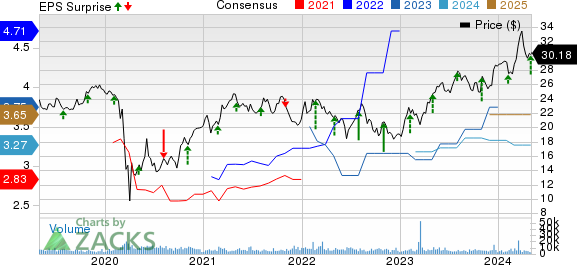
Radian Group Inc. Price, Consensus and EPS Surprise

Radian Group Inc. price-consensus-eps-surprise-chart | Radian Group Inc. Quote
Quarter in Details
Operating revenues rose 4.8% year over year to $318.9 million, primarily due to higher net premiums earned, services revenues and net investment income.
Net premiums earned were $235.8 million, up 1.1% year over year. Net investment income jumped 18.4% year over year to $69.2 million.
MI New Insurance Written rose 2.4% year over year to $11.5 billion.
Primary mortgage insurance in force was $271 billion as of Mar 31, 2024, up 4% year over year.
Persistency — the percentage of mortgage insurance in force that remains in the company’s books after a 12-month period — was 84% as of Mar 31, 2024, up 200 basis points (bps) year over year.
Primary delinquent loans were 20,850 as of Mar 31, 2024, up 0.5% year over year.
Total expenses climbed 14% year over year to $120.8 million on account of higher policy acquisition costs and interest expenses.
The expense ratio was 25, which improved 90 bps from the year-ago quarter.
Segmental Update
The Mortgage segment reported a year-over-year increase of 2% in total revenues to $285 million. Net premiums earned by the segment were $233 million, up 1.1% year over year. Claims paid were $3 million, which remained flat year over year. The loss ratio was (2.9) compared with (7.3) in the year-ago quarter.
Financial Update
As of Mar 31, 2024, Radian Group had a solid cash balance of $26.9 million, up 42% from the end of 2023. The debt-to-capital ratio deteriorated 100 bps to 25.4 from the 2023-end level.
Book value per share, a measure of net worth, climbed 11.7% year over year to $29.30 as of Mar 31, 2024.
In the first quarter, the adjusted net operating return on equity was 14.5%, which contracted 120 bps year over year.
As of Mar 31, 2024, Available Assets under PMIERs totaled nearly $6 billion, which resulted in PMIERs excess Available Assets of $2.3 billion.
Share Repurchase and Dividend Update
Radian Group bought back 1.8 million shares worth $50 million, including commissions, in the first quarter. The remaining repurchase capacity was $117 million as of Mar 31, 2024.
The board raised the quarterly dividend by 9% to 24.5 cents per share. Total dividend paid to stockholders was $37 million as of Mar 12, 2024.
Zacks Rank
Radian Group currently carries a Zacks Rank #3 (Hold). You can see the complete list of today’s Zacks #1 Rank (Strong Buy) stocks here.
Performance of Other Multi-Line Insurers
CNO Financial Group, Inc. CNO reported first-quarter 2024 adjusted earnings per share of 52 cents, which missed the Zacks Consensus Estimate by 18.8%. However, the bottom line rose 2% year over year. Total revenues increased 14.9% year over year to $1.2 billion. The top line beat the consensus mark by 23.6%. Total insurance policy income of $628.4 million improved 0.5% year over year but missed the Zacks Consensus Estimate by 1.1% due to a decline in health insurance policy income.
CNO’s net investment income soared 36.8% year over year to $469.2 million in the first quarter. General account assets grew 3.3% year over year to $301.9 million but missed the consensus mark by 1.2%. Also, the policyholder and other special-purpose portfolios jumped more than two times to $167.3 million. Annuity collected premiums of $393.3 million increased 6% year over year. New annualized premiums for health and life products advanced 8.2% year over year to $104.5 million.
The Hartford Financial Services Group, Inc. HIG reported first-quarter 2024 adjusted operating earnings of $2.34 per share, which lagged the Zacks Consensus Estimate by 3.7%. However, the bottom line climbed 39.3% year over year. Operating revenues of HIG amounted to $4.3 billion, which improved 10.8% year over year in the quarter under review. However, the top line missed the consensus mark of $4.4 billion. Earned premiums rose 7.6% year over year to $5.4 billion in the reported quarter but missed the Zacks Consensus Estimate by 1.9%.
Pre-tax net investment income of $593 million grew 15.1% year over year but missed the consensus mark by 8%. Net investment income witnessed year-over-year growth in all the segments. Total benefits, losses and expenses increased 4.5% year over year to $5.5 billion. Pretax income of $911 million advanced 39.5% year over year.
Prudential Financial, Inc. PRU reported first-quarter 2024 adjusted operating income of $3.12 per share, which missed the Zacks Consensus Estimate by 1.2%. The bottom line climbed 15.5% year over year. Total revenues of $21.7 billion jumped 44.8% year over year, beating the Zacks Consensus Estimate by 46.8%. Total benefits and expenses amounted to $20.2 billion, which soared 47.6% year over year. The figure was higher than our estimate of $11.7 billion.
Prudential Global Investment Management’s (PGIM) adjusted operating income of $169 million increased 12% year over year. The metric beat the Zacks Consensus Estimate by 14%. Our estimate was $137.2 million. PGIM’s assets under management of $1.341 trillion in the reported quarter rose 6% year over year. The U.S. Businesses delivered an adjusted operating income of $839 million, which grew 10.4% year over year. The metric missed the Zacks Consensus Estimate by 12%. Our estimate was $1 billion.
Want the latest recommendations from Zacks Investment Research? Today, you can download 7 Best Stocks for the Next 30 Days. Click to get this free report
The Hartford Financial Services Group, Inc. (HIG) : Free Stock Analysis Report
CNO Financial Group, Inc. (CNO) : Free Stock Analysis Report
Prudential Financial, Inc. (PRU) : Free Stock Analysis Report
Radian Group Inc. (RDN) : Free Stock Analysis Report

 Yahoo Finance