
 Yahoo Finance
 The past three years for Fastly (NYSE:FSLY) investors has not been profitable
As an investor, mistakes are inevitable. But really bad investments should be rare. So spare a thought for the long term shareholders of Fastly, Inc. (NYSE:FSLY); the share price is down a whopping 86% in the last three years. That might cause some serious doubts about the merits of the initial decision to buy the stock, to put it mildly. And the ride hasn't got any smoother in recent times over the last year, with the price 58% lower in that time. Shareholders have had an even rougher run lately, with the share price down 41% in the last 90 days. We really hope anyone holding through that price crash has a diversified portfolio. Even when you lose money, you don't have to lose the lesson.
Since shareholders are down over the longer term, lets look at the underlying fundamentals over the that time and see if they've been consistent with returns.
View our latest analysis for Fastly
Fastly wasn't profitable in the last twelve months, it is unlikely we'll see a strong correlation between its share price and its earnings per share (EPS). Arguably revenue is our next best option. Shareholders of unprofitable companies usually desire strong revenue growth. Some companies are willing to postpone profitability to grow revenue faster, but in that case one would hope for good top-line growth to make up for the lack of earnings.
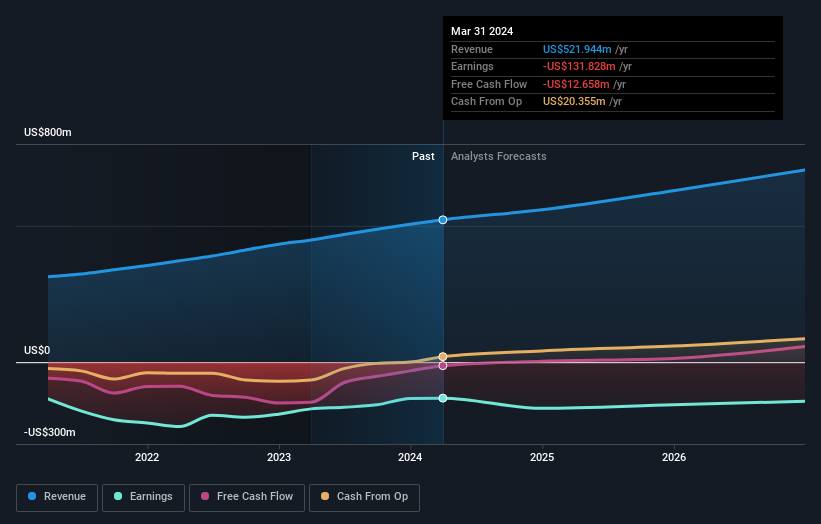
In the last three years, Fastly saw its revenue grow by 18% per year, compound. That's a pretty good rate of top-line growth. So it seems unlikely the 23% share price drop (each year) is entirely about the revenue. More likely, the market was spooked by the cost of that revenue. If you buy into companies that lose money then you always risk losing money yourself. Just don't lose the lesson.
You can see below how earnings and revenue have changed over time (discover the exact values by clicking on the image).
Fastly is a well known stock, with plenty of analyst coverage, suggesting some visibility into future growth. So we recommend checking out this free report showing consensus forecasts
A Different Perspective
Fastly shareholders are down 58% for the year, but the market itself is up 24%. However, keep in mind that even the best stocks will sometimes underperform the market over a twelve month period. Unfortunately, last year's performance may indicate unresolved challenges, given that it was worse than the annualised loss of 10% over the last half decade. Generally speaking long term share price weakness can be a bad sign, though contrarian investors might want to research the stock in hope of a turnaround. I find it very interesting to look at share price over the long term as a proxy for business performance. But to truly gain insight, we need to consider other information, too. For instance, we've identified 4 warning signs for Fastly that you should be aware of.
If you would prefer to check out another company -- one with potentially superior financials -- then do not miss this free list of companies that have proven they can grow earnings.
Please note, the market returns quoted in this article reflect the market weighted average returns of stocks that currently trade on American exchanges.
Have feedback on this article? Concerned about the content? Get in touch with us directly. Alternatively, email editorial-team (at) simplywallst.com.
This article by Simply Wall St is general in nature. We provide commentary based on historical data and analyst forecasts only using an unbiased methodology and our articles are not intended to be financial advice. It does not constitute a recommendation to buy or sell any stock, and does not take account of your objectives, or your financial situation. We aim to bring you long-term focused analysis driven by fundamental data. Note that our analysis may not factor in the latest price-sensitive company announcements or qualitative material. Simply Wall St has no position in any stocks mentioned.

