
 Yahoo Finance
 Orell Füssli (VTX:OFN) Hasn't Managed To Accelerate Its Returns
If you're not sure where to start when looking for the next multi-bagger, there are a few key trends you should keep an eye out for. Firstly, we'd want to identify a growing return on capital employed (ROCE) and then alongside that, an ever-increasing base of capital employed. Put simply, these types of businesses are compounding machines, meaning they are continually reinvesting their earnings at ever-higher rates of return. However, after briefly looking over the numbers, we don't think Orell Füssli (VTX:OFN) has the makings of a multi-bagger going forward, but let's have a look at why that may be.
Understanding Return On Capital Employed (ROCE)
For those that aren't sure what ROCE is, it measures the amount of pre-tax profits a company can generate from the capital employed in its business. The formula for this calculation on Orell Füssli is:
Return on Capital Employed = Earnings Before Interest and Tax (EBIT) ÷ (Total Assets - Current Liabilities)
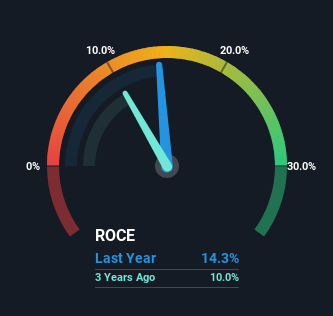
0.14 = CHF19m ÷ (CHF179m - CHF42m) (Based on the trailing twelve months to December 2023).
Therefore, Orell Füssli has an ROCE of 14%. In absolute terms, that's a satisfactory return, but compared to the Commercial Services industry average of 10% it's much better.
View our latest analysis for Orell Füssli
Above you can see how the current ROCE for Orell Füssli compares to its prior returns on capital, but there's only so much you can tell from the past. If you're interested, you can view the analysts predictions in our free analyst report for Orell Füssli .
What Does the ROCE Trend For Orell Füssli Tell Us?
There hasn't been much to report for Orell Füssli's returns and its level of capital employed because both metrics have been steady for the past five years. This tells us the company isn't reinvesting in itself, so it's plausible that it's past the growth phase. With that in mind, unless investment picks up again in the future, we wouldn't expect Orell Füssli to be a multi-bagger going forward. On top of that you'll notice that Orell Füssli has been paying out a large portion (69%) of earnings in the form of dividends to shareholders. If the company is in fact lacking growth opportunities, that's one of the viable alternatives for the money.
The Key Takeaway
In summary, Orell Füssli isn't compounding its earnings but is generating stable returns on the same amount of capital employed. Unsurprisingly, the stock has only gained 2.8% over the last five years, which potentially indicates that investors are accounting for this going forward. As a result, if you're hunting for a multi-bagger, we think you'd have more luck elsewhere.
If you'd like to know about the risks facing Orell Füssli, we've discovered 1 warning sign that you should be aware of.
If you want to search for solid companies with great earnings, check out this free list of companies with good balance sheets and impressive returns on equity.
Have feedback on this article? Concerned about the content? Get in touch with us directly. Alternatively, email editorial-team (at) simplywallst.com.
This article by Simply Wall St is general in nature. We provide commentary based on historical data and analyst forecasts only using an unbiased methodology and our articles are not intended to be financial advice. It does not constitute a recommendation to buy or sell any stock, and does not take account of your objectives, or your financial situation. We aim to bring you long-term focused analysis driven by fundamental data. Note that our analysis may not factor in the latest price-sensitive company announcements or qualitative material. Simply Wall St has no position in any stocks mentioned.
