
 Yahoo Finance
 National Beverage (NASDAQ:FIZZ) Is Reinvesting At Lower Rates Of Return
If we want to find a stock that could multiply over the long term, what are the underlying trends we should look for? One common approach is to try and find a company with returns on capital employed (ROCE) that are increasing, in conjunction with a growing amount of capital employed. This shows us that it's a compounding machine, able to continually reinvest its earnings back into the business and generate higher returns. Looking at National Beverage (NASDAQ:FIZZ), it does have a high ROCE right now, but lets see how returns are trending.
Understanding Return On Capital Employed (ROCE)
For those who don't know, ROCE is a measure of a company's yearly pre-tax profit (its return), relative to the capital employed in the business. Analysts use this formula to calculate it for National Beverage:
Return on Capital Employed = Earnings Before Interest and Tax (EBIT) ÷ (Total Assets - Current Liabilities)
0.37 = US$214m ÷ (US$720m - US$133m) (Based on the trailing twelve months to January 2024).
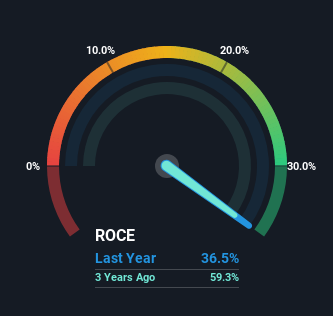
So, National Beverage has an ROCE of 37%. That's a fantastic return and not only that, it outpaces the average of 17% earned by companies in a similar industry.
See our latest analysis for National Beverage
Above you can see how the current ROCE for National Beverage compares to its prior returns on capital, but there's only so much you can tell from the past. If you'd like, you can check out the forecasts from the analysts covering National Beverage for free.
So How Is National Beverage's ROCE Trending?
On the surface, the trend of ROCE at National Beverage doesn't inspire confidence. While it's comforting that the ROCE is high, five years ago it was 59%. On the other hand, the company has been employing more capital without a corresponding improvement in sales in the last year, which could suggest these investments are longer term plays. It may take some time before the company starts to see any change in earnings from these investments.
On a side note, National Beverage has done well to pay down its current liabilities to 18% of total assets. So we could link some of this to the decrease in ROCE. What's more, this can reduce some aspects of risk to the business because now the company's suppliers or short-term creditors are funding less of its operations. Since the business is basically funding more of its operations with it's own money, you could argue this has made the business less efficient at generating ROCE.
The Bottom Line
Bringing it all together, while we're somewhat encouraged by National Beverage's reinvestment in its own business, we're aware that returns are shrinking. Investors must think there's better things to come because the stock has knocked it out of the park, delivering a 116% gain to shareholders who have held over the last five years. Ultimately, if the underlying trends persist, we wouldn't hold our breath on it being a multi-bagger going forward.
One more thing to note, we've identified 2 warning signs with National Beverage and understanding these should be part of your investment process.
High returns are a key ingredient to strong performance, so check out our free list ofstocks earning high returns on equity with solid balance sheets.
Have feedback on this article? Concerned about the content? Get in touch with us directly. Alternatively, email editorial-team (at) simplywallst.com.
This article by Simply Wall St is general in nature. We provide commentary based on historical data and analyst forecasts only using an unbiased methodology and our articles are not intended to be financial advice. It does not constitute a recommendation to buy or sell any stock, and does not take account of your objectives, or your financial situation. We aim to bring you long-term focused analysis driven by fundamental data. Note that our analysis may not factor in the latest price-sensitive company announcements or qualitative material. Simply Wall St has no position in any stocks mentioned.
