
 Yahoo Finance
 Mohawk Industries' (NYSE:MHK) Returns On Capital Not Reflecting Well On The Business
Ignoring the stock price of a company, what are the underlying trends that tell us a business is past the growth phase? When we see a declining return on capital employed (ROCE) in conjunction with a declining base of capital employed, that's often how a mature business shows signs of aging. This reveals that the company isn't compounding shareholder wealth because returns are falling and its net asset base is shrinking. So after glancing at the trends within Mohawk Industries (NYSE:MHK), we weren't too hopeful.
What Is Return On Capital Employed (ROCE)?
For those that aren't sure what ROCE is, it measures the amount of pre-tax profits a company can generate from the capital employed in its business. To calculate this metric for Mohawk Industries, this is the formula:
Return on Capital Employed = Earnings Before Interest and Tax (EBIT) ÷ (Total Assets - Current Liabilities)
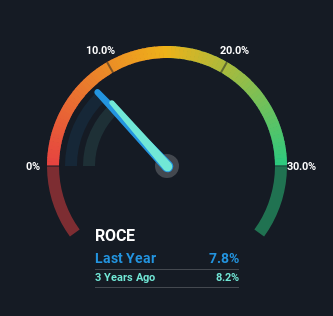
0.078 = US$810m ÷ (US$14b - US$3.1b) (Based on the trailing twelve months to March 2024).
Therefore, Mohawk Industries has an ROCE of 7.8%. In absolute terms, that's a low return and it also under-performs the Consumer Durables industry average of 15%.
See our latest analysis for Mohawk Industries
Above you can see how the current ROCE for Mohawk Industries compares to its prior returns on capital, but there's only so much you can tell from the past. If you'd like to see what analysts are forecasting going forward, you should check out our free analyst report for Mohawk Industries .
What Does the ROCE Trend For Mohawk Industries Tell Us?
In terms of Mohawk Industries' historical ROCE movements, the trend doesn't inspire confidence. About five years ago, returns on capital were 11%, however they're now substantially lower than that as we saw above. And on the capital employed front, the business is utilizing roughly the same amount of capital as it was back then. Since returns are falling and the business has the same amount of assets employed, this can suggest it's a mature business that hasn't had much growth in the last five years. If these trends continue, we wouldn't expect Mohawk Industries to turn into a multi-bagger.
In Conclusion...
In the end, the trend of lower returns on the same amount of capital isn't typically an indication that we're looking at a growth stock. Long term shareholders who've owned the stock over the last five years have experienced a 18% depreciation in their investment, so it appears the market might not like these trends either. With underlying trends that aren't great in these areas, we'd consider looking elsewhere.
On a final note, we've found 1 warning sign for Mohawk Industries that we think you should be aware of.
While Mohawk Industries may not currently earn the highest returns, we've compiled a list of companies that currently earn more than 25% return on equity. Check out this free list here.
Have feedback on this article? Concerned about the content? Get in touch with us directly. Alternatively, email editorial-team (at) simplywallst.com.
This article by Simply Wall St is general in nature. We provide commentary based on historical data and analyst forecasts only using an unbiased methodology and our articles are not intended to be financial advice. It does not constitute a recommendation to buy or sell any stock, and does not take account of your objectives, or your financial situation. We aim to bring you long-term focused analysis driven by fundamental data. Note that our analysis may not factor in the latest price-sensitive company announcements or qualitative material. Simply Wall St has no position in any stocks mentioned.
