
 Yahoo Finance
 Macquarie Group Ltd's Dividend Analysis
Exploring the Sustainability and Growth of Dividends at Macquarie Group Ltd
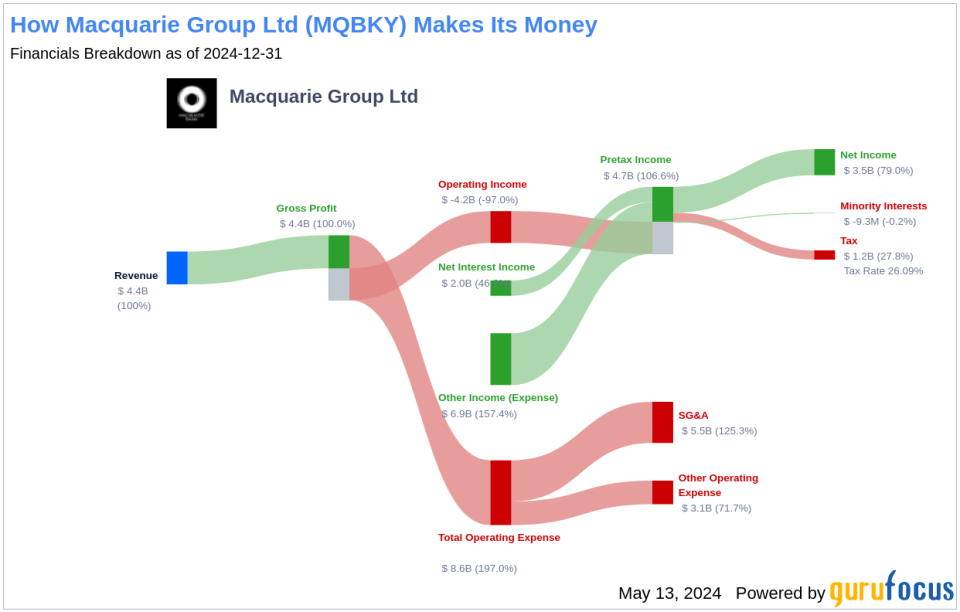
Macquarie Group Ltd (MQBKY) recently announced a dividend of $2.55 per share, payable on 2024-07-12, with the ex-dividend date set for 2024-05-13. As investors look forward to this upcoming payment, the spotlight also shines on the company's dividend history, yield, and growth rates. Using the data from GuruFocus, let's look into Macquarie Group Ltd's dividend performance and assess its sustainability.
What Does Macquarie Group Ltd Do?
Warning! GuruFocus has detected 11 Warning Signs with MQBKY.
This Powerful Chart Made Peter Lynch 29% A Year For 13 Years
How to calculate the intrinsic value of a stock?
Macquarie Group Ltd began trading in 1969 as Hill Samuel Australia, obtained its bank licence in 1985, and listed in 1996. It's Australia's only sizable listed investment bank, now internationally diversified, operating in asset management, banking and wealth, risk and capital solutions, and advisory.
A Glimpse at Macquarie Group Ltd's Dividend History
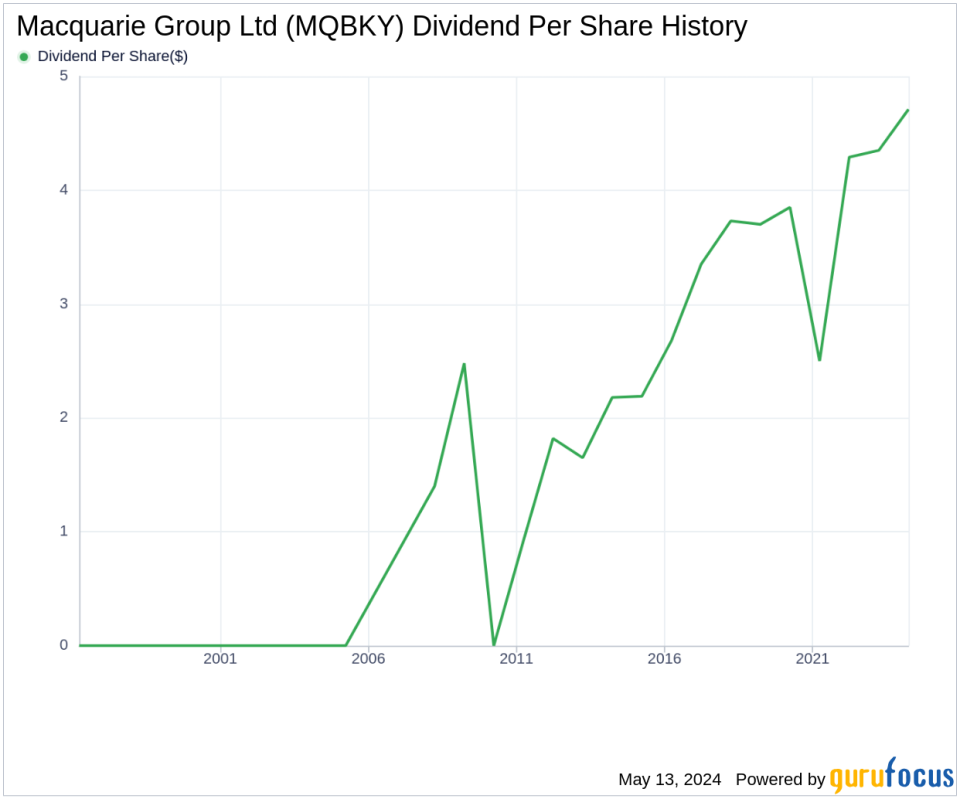
Macquarie Group Ltd has maintained a consistent dividend payment record since 2010. Dividends are currently distributed on a bi-annually basis. Below is a chart showing annual Dividends Per Share for tracking historical trends.
Breaking Down Macquarie Group Ltd's Dividend Yield and Growth
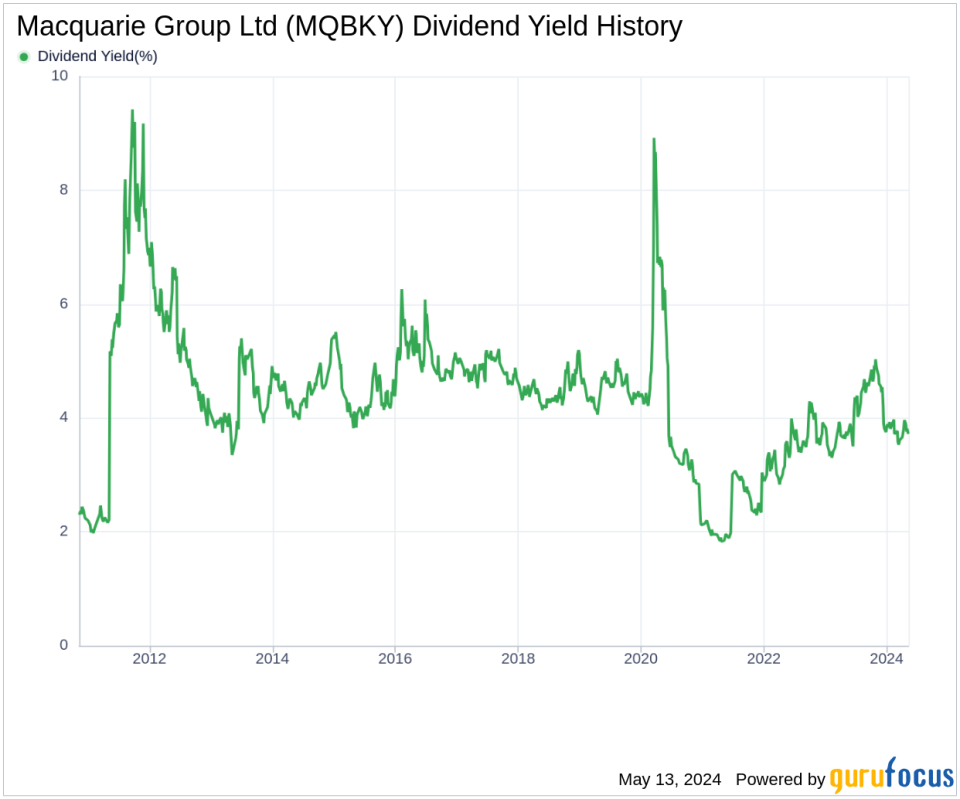
As of today, Macquarie Group Ltd currently has a 12-month trailing dividend yield of 3.65% and a 12-month forward dividend yield of 3.30%. This suggests an expectation of decrease dividend payments over the next 12 months.
Over the past three years, Macquarie Group Ltd's annual dividend growth rate was 30.80%. Extended to a five-year horizon, this rate decreased to 6.60% per year. And over the past decade, Macquarie Group Ltd's annual dividends per share growth rate stands at 9.30%.
Based on Macquarie Group Ltd's dividend yield and five-year growth rate, the 5-year yield on cost of Macquarie Group Ltd stock as of today is approximately 5.02%.
The Sustainability Question: Payout Ratio and Profitability
To assess the sustainability of the dividend, one needs to evaluate the company's payout ratio. The dividend payout ratio provides insights into the portion of earnings the company distributes as dividends. A lower ratio suggests that the company retains a significant part of its earnings, thereby ensuring the availability of funds for future growth and unexpected downturns. As of 2024-03-31, Macquarie Group Ltd's dividend payout ratio is 0.82, which may suggest that the company's dividend may not be sustainable.
Macquarie Group Ltd's profitability rank, offers an understanding of the company's earnings prowess relative to its peers. GuruFocus ranks Macquarie Group Ltd's profitability 5 out of 10 as of 2024-03-31, suggesting fair profitability. The company has reported positive net income for each of year over the past decade, further solidifying its high profitability.
Growth Metrics: The Future Outlook
To ensure the sustainability of dividends, a company must have robust growth metrics. Macquarie Group Ltd's growth rank of 5 out of 10 suggests that the company has a fair growth outlook.
Revenue is the lifeblood of any company, and Macquarie Group Ltd's revenue per share, combined with the 3-year revenue growth rate, indicates a strong revenue model. Macquarie Group Ltd's revenue has increased by approximately 4.50% per year on average, a rate that underperforms than approximately 50.87% of global competitors.
The company's 3-year EPS growth rate showcases its capability to grow its earnings, a critical component for sustaining dividends in the long run. During the past three years, Macquarie Group Ltd's earnings increased by approximately 0.90% per year on average, a rate that underperforms than approximately 57.8% of global competitors.
Lastly, the company's 5-year EBITDA growth rate of 4.60%, which underperforms than approximately 65.8% of global competitors.
Conclusion: Evaluating Dividend Sustainability at Macquarie Group Ltd
Given Macquarie Group Ltd's consistent dividend payments, growth in dividends over time, and a moderate profitability and growth outlook, investors might find the stock an appealing choice for dividend income. However, the sustainability of these dividends warrants caution due to the payout ratio and mixed growth metrics. Investors should continue to monitor these aspects to ensure long-term dividend reliability.
GuruFocus Premium users can screen for high-dividend yield stocks using the High Dividend Yield Screener.
This article, generated by GuruFocus, is designed to provide general insights and is not tailored financial advice. Our commentary is rooted in historical data and analyst projections, utilizing an impartial methodology, and is not intended to serve as specific investment guidance. It does not formulate a recommendation to purchase or divest any stock and does not consider individual investment objectives or financial circumstances. Our objective is to deliver long-term, fundamental data-driven analysis. Be aware that our analysis might not incorporate the most recent, price-sensitive company announcements or qualitative information. GuruFocus holds no position in the stocks mentioned herein.
This article first appeared on GuruFocus.
