
 Yahoo Finance
 Loblaw Companies Ltd's Dividend Analysis
Exploring the Dividend Dynamics of Canada's Largest Retailer
Loblaw Companies Ltd (LBLCF) recently announced a dividend of $0.51 per share, payable on 2024-07-01, with the ex-dividend date set for 2024-06-14. As investors look forward to this upcoming payment, the spotlight also shines on the company's dividend history, yield, and growth rates. Using the data from GuruFocus, let's look into Loblaw Companies Ltd's dividend performance and assess its sustainability.
What Does Loblaw Companies Ltd Do?
This Powerful Chart Made Peter Lynch 29% A Year For 13 Years
How to calculate the intrinsic value of a stock?
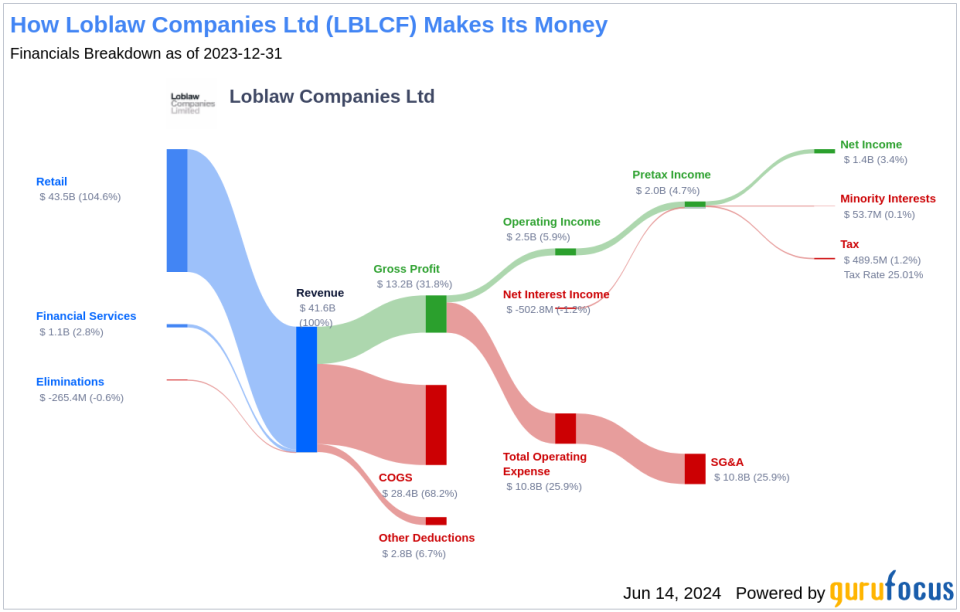
Loblaw is Canada's largest retailer, operating 2,500 food retail and pharmacy stores across the country. Its main grocery banners include Loblaw, No Frills, and Maxi, and its pharmacy stores are mostly under the Shoppers Drug Mart banner, which it acquired in 2014. In addition to brand-name offerings, Loblaw offers private-label products under the President's Choice and No Name brands. Beyond retail, Loblaw runs the PC Optimum loyalty program and also offers credit cards and insurance brokerage, which are collectively referred to as financial services. George Weston is Loblaw's controlling shareholder with a 53% stake.
A Glimpse at Loblaw Companies Ltd's Dividend History
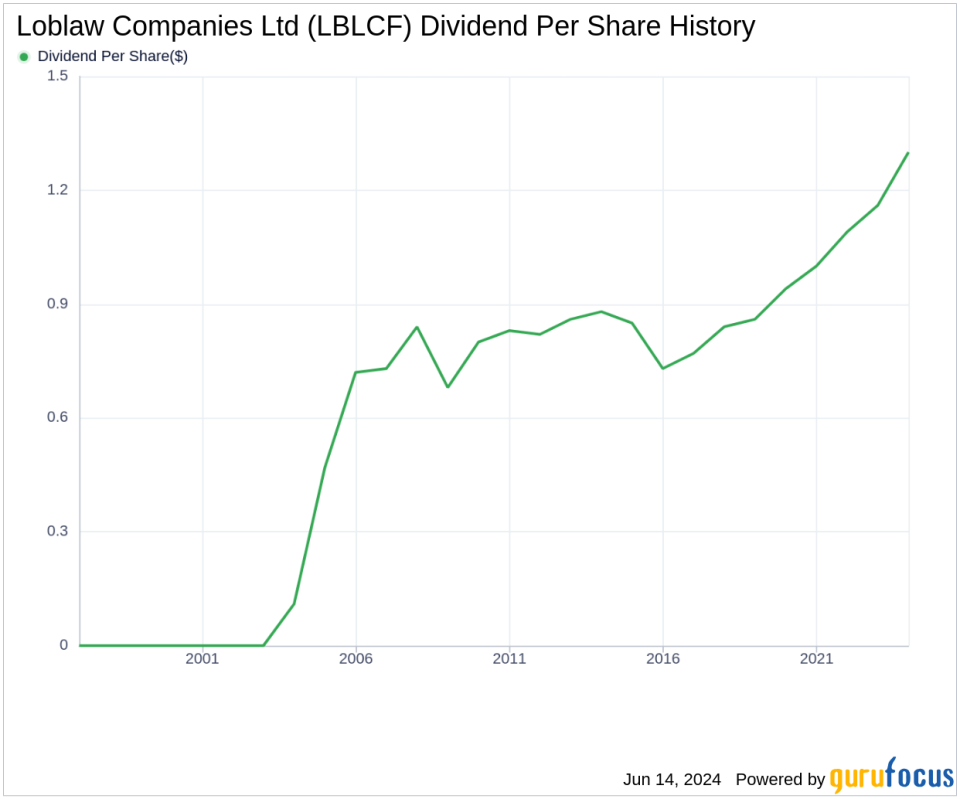
Loblaw Companies Ltd has maintained a consistent dividend payment record since 2003. Dividends are currently distributed on a quarterly basis.
Loblaw Companies Ltd has increased its dividend each year since 2003. The stock is thus listed as a dividend achiever, an honor that is given to companies that have increased their dividend each year for at least the past 21 years.
Breaking Down Loblaw Companies Ltd's Dividend Yield and Growth
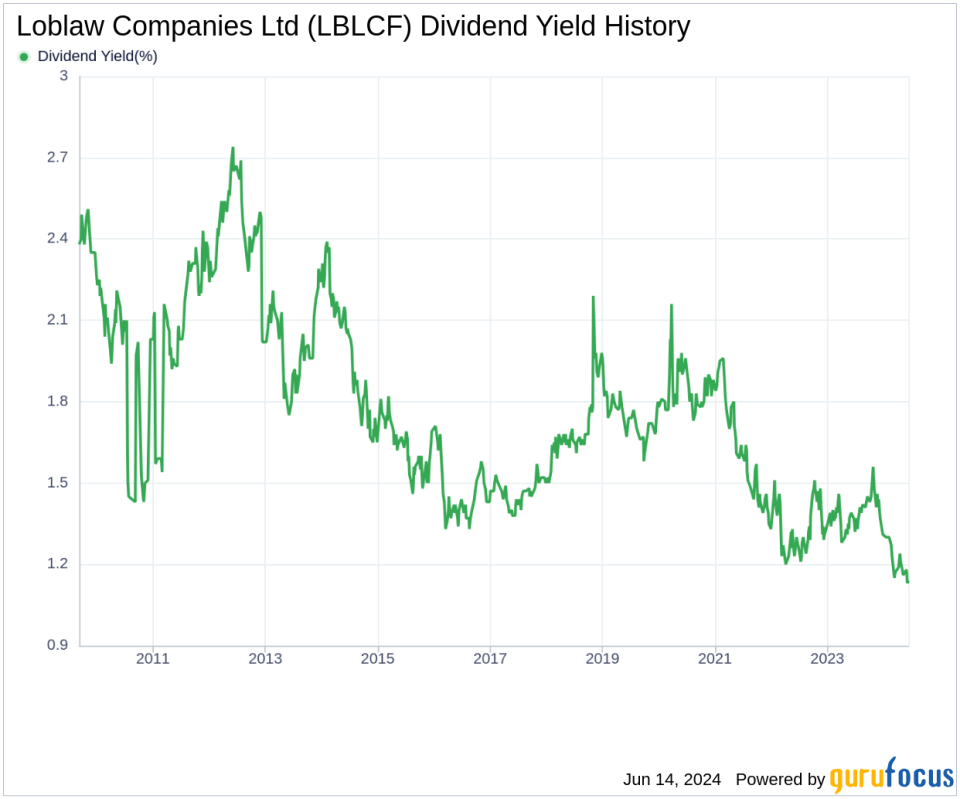
As of today, Loblaw Companies Ltd currently has a 12-month trailing dividend yield of 1.14% and a 12-month forward dividend yield of 1.29%. This suggests an expectation of increased dividend payments over the next 12 months.
Loblaw Companies Ltd's dividend yield of 1.14% is near a 10-year low and underperforms than 85.29% of global competitors in the Retail - Defensive industry, suggesting that the company's dividend yield may not be a compelling proposition for income investors.
Over the past three years, Loblaw Companies Ltd's annual dividend growth rate was 10.80%. Extended to a five-year horizon, this rate decreased to 8.60% per year. And over the past decade, Loblaw Companies Ltd's annual dividends per share growth rate stands at 6.20%.
The Sustainability Question: Payout Ratio and Profitability
To assess the sustainability of the dividend, one needs to evaluate the company's payout ratio. The dividend payout ratio provides insights into the portion of earnings the company distributes as dividends. A lower ratio suggests that the company retains a significant part of its earnings, thereby ensuring the availability of funds for future growth and unexpected downturns. As of 2024-03-31, Loblaw Companies Ltd's dividend payout ratio is 0.27.
Loblaw Companies Ltd's profitability rank, offers an understanding of the company's earnings prowess relative to its peers. GuruFocus ranks Loblaw Companies Ltd's profitability 8 out of 10 as of 2024-03-31, suggesting good profitability prospects. The company has reported positive net income for each of year over the past decade, further solidifying its high profitability.
Growth Metrics: The Future Outlook
To ensure the sustainability of dividends, a company must have robust growth metrics. Loblaw Companies Ltd's growth rank of 8 out of 10 suggests that the company's growth trajectory is good relative to its competitors.
Revenue is the lifeblood of any company, and Loblaw Companies Ltd's revenue per share, combined with the 3-year revenue growth rate, indicates a strong revenue model. Loblaw Companies Ltd's revenue has increased by approximately 8.10% per year on average, a rate that outperforms approximately 62.46% of global competitors.
The company's 3-year EPS growth rate showcases its capability to grow its earnings, a critical component for sustaining dividends in the long run. During the past three years, Loblaw Companies Ltd's earnings increased by approximately 22.80% per year on average, a rate that outperforms approximately 71.67% of global competitors.
Lastly, the company's 5-year EBITDA growth rate of 15.50%, which outperforms approximately 65.45% of global competitors.
Next Steps
With a robust dividend history, a sustainable payout ratio, and strong growth metrics, Loblaw Companies Ltd appears well-positioned to continue its record of dividend payments. Investors seeking to diversify their portfolio with a stable dividend-paying stock may find Loblaw Companies Ltd an appealing option. For those looking to further explore high-dividend yield opportunities, GuruFocus Premium users can utilize the High Dividend Yield Screener.
This article, generated by GuruFocus, is designed to provide general insights and is not tailored financial advice. Our commentary is rooted in historical data and analyst projections, utilizing an impartial methodology, and is not intended to serve as specific investment guidance. It does not formulate a recommendation to purchase or divest any stock and does not consider individual investment objectives or financial circumstances. Our objective is to deliver long-term, fundamental data-driven analysis. Be aware that our analysis might not incorporate the most recent, price-sensitive company announcements or qualitative information. GuruFocus holds no position in the stocks mentioned herein.
This article first appeared on GuruFocus.
