
 Yahoo Finance
 JD.com (NASDAQ:JD) Shareholders Will Want The ROCE Trajectory To Continue
If you're not sure where to start when looking for the next multi-bagger, there are a few key trends you should keep an eye out for. Typically, we'll want to notice a trend of growing return on capital employed (ROCE) and alongside that, an expanding base of capital employed. If you see this, it typically means it's a company with a great business model and plenty of profitable reinvestment opportunities. With that in mind, we've noticed some promising trends at JD.com (NASDAQ:JD) so let's look a bit deeper.
Return On Capital Employed (ROCE): What Is It?
Just to clarify if you're unsure, ROCE is a metric for evaluating how much pre-tax income (in percentage terms) a company earns on the capital invested in its business. Analysts use this formula to calculate it for JD.com:
Return on Capital Employed = Earnings Before Interest and Tax (EBIT) ÷ (Total Assets - Current Liabilities)
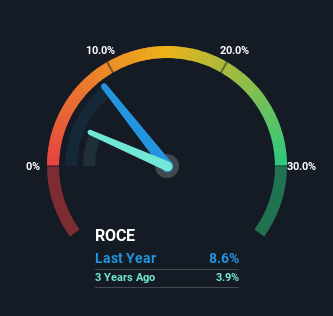
0.086 = CN¥31b ÷ (CN¥602b - CN¥246b) (Based on the trailing twelve months to March 2024).
Therefore, JD.com has an ROCE of 8.6%. Ultimately, that's a low return and it under-performs the Multiline Retail industry average of 11%.
Check out our latest analysis for JD.com
In the above chart we have measured JD.com's prior ROCE against its prior performance, but the future is arguably more important. If you're interested, you can view the analysts predictions in our free analyst report for JD.com .
What The Trend Of ROCE Can Tell Us
JD.com has recently broken into profitability so their prior investments seem to be paying off. The company was generating losses five years ago, but now it's earning 8.6% which is a sight for sore eyes. In addition to that, JD.com is employing 258% more capital than previously which is expected of a company that's trying to break into profitability. This can tell us that the company has plenty of reinvestment opportunities that are able to generate higher returns.
On a related note, the company's ratio of current liabilities to total assets has decreased to 41%, which basically reduces it's funding from the likes of short-term creditors or suppliers. This tells us that JD.com has grown its returns without a reliance on increasing their current liabilities, which we're very happy with. Nevertheless, there are some potential risks the company is bearing with current liabilities that high, so just keep that in mind.
The Bottom Line
Overall, JD.com gets a big tick from us thanks in most part to the fact that it is now profitable and is reinvesting in its business. Since the stock has returned a solid 43% to shareholders over the last five years, it's fair to say investors are beginning to recognize these changes. Therefore, we think it would be worth your time to check if these trends are going to continue.
If you'd like to know about the risks facing JD.com, we've discovered 1 warning sign that you should be aware of.
For those who like to invest in solid companies, check out this free list of companies with solid balance sheets and high returns on equity.
Have feedback on this article? Concerned about the content? Get in touch with us directly. Alternatively, email editorial-team (at) simplywallst.com.
This article by Simply Wall St is general in nature. We provide commentary based on historical data and analyst forecasts only using an unbiased methodology and our articles are not intended to be financial advice. It does not constitute a recommendation to buy or sell any stock, and does not take account of your objectives, or your financial situation. We aim to bring you long-term focused analysis driven by fundamental data. Note that our analysis may not factor in the latest price-sensitive company announcements or qualitative material. Simply Wall St has no position in any stocks mentioned.
