
 Yahoo Finance
 Investors Will Want Gear Energy's (TSE:GXE) Growth In ROCE To Persist
If we want to find a stock that could multiply over the long term, what are the underlying trends we should look for? In a perfect world, we'd like to see a company investing more capital into its business and ideally the returns earned from that capital are also increasing. This shows us that it's a compounding machine, able to continually reinvest its earnings back into the business and generate higher returns. With that in mind, we've noticed some promising trends at Gear Energy (TSE:GXE) so let's look a bit deeper.
Understanding Return On Capital Employed (ROCE)
If you haven't worked with ROCE before, it measures the 'return' (pre-tax profit) a company generates from capital employed in its business. To calculate this metric for Gear Energy, this is the formula:
Return on Capital Employed = Earnings Before Interest and Tax (EBIT) ÷ (Total Assets - Current Liabilities)
0.11 = CA$37m ÷ (CA$349m - CA$27m) (Based on the trailing twelve months to September 2023).
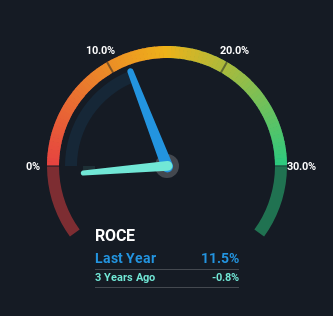
Thus, Gear Energy has an ROCE of 11%. That's a relatively normal return on capital, and it's around the 10% generated by the Oil and Gas industry.
View our latest analysis for Gear Energy
In the above chart we have measured Gear Energy's prior ROCE against its prior performance, but the future is arguably more important. If you're interested, you can view the analysts predictions in our free report on analyst forecasts for the company.
So How Is Gear Energy's ROCE Trending?
Gear Energy has broken into the black (profitability) and we're sure it's a sight for sore eyes. The company now earns 11% on its capital, because five years ago it was incurring losses. While returns have increased, the amount of capital employed by Gear Energy has remained flat over the period. With no noticeable increase in capital employed, it's worth knowing what the company plans on doing going forward in regards to reinvesting and growing the business. So if you're looking for high growth, you'll want to see a business's capital employed also increasing.
What We Can Learn From Gear Energy's ROCE
In summary, we're delighted to see that Gear Energy has been able to increase efficiencies and earn higher rates of return on the same amount of capital. Since the stock has only returned 23% to shareholders over the last five years, the promising fundamentals may not be recognized yet by investors. So exploring more about this stock could uncover a good opportunity, if the valuation and other metrics stack up.
If you'd like to know about the risks facing Gear Energy, we've discovered 3 warning signs that you should be aware of.
If you want to search for solid companies with great earnings, check out this free list of companies with good balance sheets and impressive returns on equity.
Have feedback on this article? Concerned about the content? Get in touch with us directly. Alternatively, email editorial-team (at) simplywallst.com.
This article by Simply Wall St is general in nature. We provide commentary based on historical data and analyst forecasts only using an unbiased methodology and our articles are not intended to be financial advice. It does not constitute a recommendation to buy or sell any stock, and does not take account of your objectives, or your financial situation. We aim to bring you long-term focused analysis driven by fundamental data. Note that our analysis may not factor in the latest price-sensitive company announcements or qualitative material. Simply Wall St has no position in any stocks mentioned.
