
 Yahoo Finance
 Investors in Varex Imaging (NASDAQ:VREX) have unfortunately lost 46% over the last five years
Ideally, your overall portfolio should beat the market average. But even the best stock picker will only win with some selections. At this point some shareholders may be questioning their investment in Varex Imaging Corporation (NASDAQ:VREX), since the last five years saw the share price fall 46%. And it's not just long term holders hurting, because the stock is down 32% in the last year. The falls have accelerated recently, with the share price down 12% in the last three months.
So let's have a look and see if the longer term performance of the company has been in line with the underlying business' progress.
See our latest analysis for Varex Imaging
In his essay The Superinvestors of Graham-and-Doddsville Warren Buffett described how share prices do not always rationally reflect the value of a business. By comparing earnings per share (EPS) and share price changes over time, we can get a feel for how investor attitudes to a company have morphed over time.
Varex Imaging became profitable within the last five years. That would generally be considered a positive, so we are surprised to see the share price is down. Other metrics might give us a better handle on how its value is changing over time.
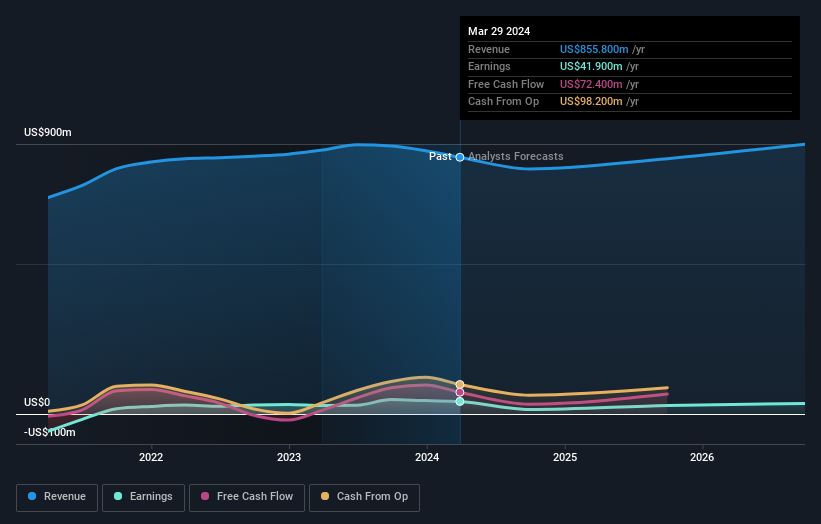
Revenue is actually up 3.5% over the time period. So it seems one might have to take closer look at the fundamentals to understand why the share price languishes. After all, there may be an opportunity.
The graphic below depicts how earnings and revenue have changed over time (unveil the exact values by clicking on the image).
It is of course excellent to see how Varex Imaging has grown profits over the years, but the future is more important for shareholders. If you are thinking of buying or selling Varex Imaging stock, you should check out this FREE detailed report on its balance sheet.
A Different Perspective
Varex Imaging shareholders are down 32% for the year, but the market itself is up 23%. However, keep in mind that even the best stocks will sometimes underperform the market over a twelve month period. Unfortunately, last year's performance may indicate unresolved challenges, given that it was worse than the annualised loss of 8% over the last half decade. We realise that Baron Rothschild has said investors should "buy when there is blood on the streets", but we caution that investors should first be sure they are buying a high quality business. I find it very interesting to look at share price over the long term as a proxy for business performance. But to truly gain insight, we need to consider other information, too. For example, we've discovered 3 warning signs for Varex Imaging (2 are concerning!) that you should be aware of before investing here.
If you would prefer to check out another company -- one with potentially superior financials -- then do not miss this free list of companies that have proven they can grow earnings.
Please note, the market returns quoted in this article reflect the market weighted average returns of stocks that currently trade on American exchanges.
Have feedback on this article? Concerned about the content? Get in touch with us directly. Alternatively, email editorial-team (at) simplywallst.com.
This article by Simply Wall St is general in nature. We provide commentary based on historical data and analyst forecasts only using an unbiased methodology and our articles are not intended to be financial advice. It does not constitute a recommendation to buy or sell any stock, and does not take account of your objectives, or your financial situation. We aim to bring you long-term focused analysis driven by fundamental data. Note that our analysis may not factor in the latest price-sensitive company announcements or qualitative material. Simply Wall St has no position in any stocks mentioned.
