
 Yahoo Finance
 Investors in Sabre Insurance Group (LON:SBRE) have unfortunately lost 20% over the last five years
For many, the main point of investing is to generate higher returns than the overall market. But the main game is to find enough winners to more than offset the losers So we wouldn't blame long term Sabre Insurance Group plc (LON:SBRE) shareholders for doubting their decision to hold, with the stock down 39% over a half decade.
It's worthwhile assessing if the company's economics have been moving in lockstep with these underwhelming shareholder returns, or if there is some disparity between the two. So let's do just that.
Check out our latest analysis for Sabre Insurance Group
To paraphrase Benjamin Graham: Over the short term the market is a voting machine, but over the long term it's a weighing machine. One way to examine how market sentiment has changed over time is to look at the interaction between a company's share price and its earnings per share (EPS).
Looking back five years, both Sabre Insurance Group's share price and EPS declined; the latter at a rate of 18% per year. This fall in the EPS is worse than the 9% compound annual share price fall. So the market may previously have expected a drop, or else it expects the situation will improve.
The graphic below depicts how EPS has changed over time (unveil the exact values by clicking on the image).
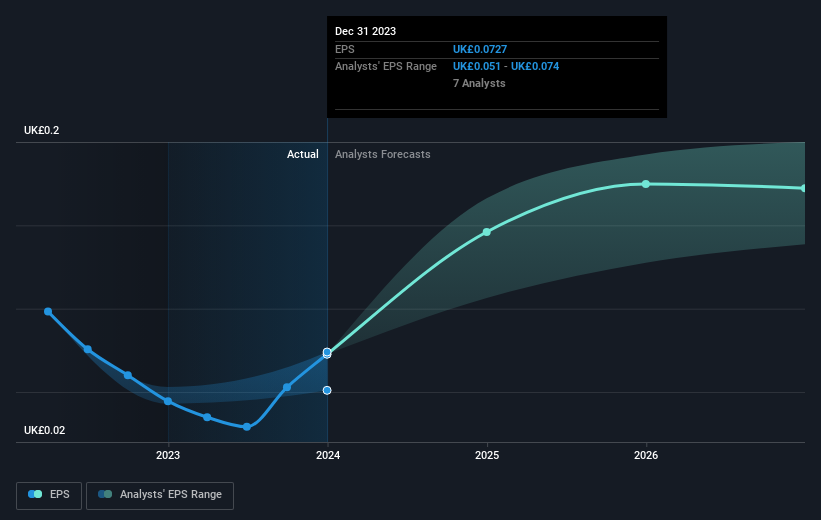
We know that Sabre Insurance Group has improved its bottom line lately, but is it going to grow revenue? Check if analysts think Sabre Insurance Group will grow revenue in the future.
What About Dividends?
It is important to consider the total shareholder return, as well as the share price return, for any given stock. The TSR incorporates the value of any spin-offs or discounted capital raisings, along with any dividends, based on the assumption that the dividends are reinvested. Arguably, the TSR gives a more comprehensive picture of the return generated by a stock. As it happens, Sabre Insurance Group's TSR for the last 5 years was -20%, which exceeds the share price return mentioned earlier. And there's no prize for guessing that the dividend payments largely explain the divergence!
A Different Perspective
We're pleased to report that Sabre Insurance Group shareholders have received a total shareholder return of 23% over one year. And that does include the dividend. That certainly beats the loss of about 4% per year over the last half decade. We generally put more weight on the long term performance over the short term, but the recent improvement could hint at a (positive) inflection point within the business. It's always interesting to track share price performance over the longer term. But to understand Sabre Insurance Group better, we need to consider many other factors. For example, we've discovered 2 warning signs for Sabre Insurance Group that you should be aware of before investing here.
Of course, you might find a fantastic investment by looking elsewhere. So take a peek at this free list of companies we expect will grow earnings.
Please note, the market returns quoted in this article reflect the market weighted average returns of stocks that currently trade on British exchanges.
Have feedback on this article? Concerned about the content? Get in touch with us directly. Alternatively, email editorial-team (at) simplywallst.com.
This article by Simply Wall St is general in nature. We provide commentary based on historical data and analyst forecasts only using an unbiased methodology and our articles are not intended to be financial advice. It does not constitute a recommendation to buy or sell any stock, and does not take account of your objectives, or your financial situation. We aim to bring you long-term focused analysis driven by fundamental data. Note that our analysis may not factor in the latest price-sensitive company announcements or qualitative material. Simply Wall St has no position in any stocks mentioned.
Have feedback on this article? Concerned about the content? Get in touch with us directly. Alternatively, email editorial-team@simplywallst.com
