
 Yahoo Finance
 Investors Could Be Concerned With Medifast's (NYSE:MED) Returns On Capital
If we want to find a potential multi-bagger, often there are underlying trends that can provide clues. Typically, we'll want to notice a trend of growing return on capital employed (ROCE) and alongside that, an expanding base of capital employed. If you see this, it typically means it's a company with a great business model and plenty of profitable reinvestment opportunities. Looking at Medifast (NYSE:MED), it does have a high ROCE right now, but lets see how returns are trending.
What Is Return On Capital Employed (ROCE)?
For those that aren't sure what ROCE is, it measures the amount of pre-tax profits a company can generate from the capital employed in its business. Analysts use this formula to calculate it for Medifast:
Return on Capital Employed = Earnings Before Interest and Tax (EBIT) ÷ (Total Assets - Current Liabilities)
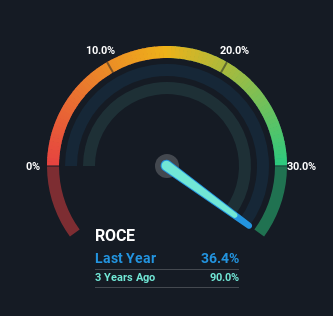
0.36 = US$82m ÷ (US$303m - US$77m) (Based on the trailing twelve months to March 2024).
So, Medifast has an ROCE of 36%. In absolute terms that's a great return and it's even better than the Personal Products industry average of 17%.
See our latest analysis for Medifast
Above you can see how the current ROCE for Medifast compares to its prior returns on capital, but there's only so much you can tell from the past. If you'd like to see what analysts are forecasting going forward, you should check out our free analyst report for Medifast .
So How Is Medifast's ROCE Trending?
On the surface, the trend of ROCE at Medifast doesn't inspire confidence. To be more specific, while the ROCE is still high, it's fallen from 59% where it was five years ago. Given the business is employing more capital while revenue has slipped, this is a bit concerning. If this were to continue, you might be looking at a company that is trying to reinvest for growth but is actually losing market share since sales haven't increased.
On a side note, Medifast has done well to pay down its current liabilities to 25% of total assets. So we could link some of this to the decrease in ROCE. Effectively this means their suppliers or short-term creditors are funding less of the business, which reduces some elements of risk. Since the business is basically funding more of its operations with it's own money, you could argue this has made the business less efficient at generating ROCE.
The Bottom Line On Medifast's ROCE
From the above analysis, we find it rather worrisome that returns on capital and sales for Medifast have fallen, meanwhile the business is employing more capital than it was five years ago. This could explain why the stock has sunk a total of 78% in the last five years. With underlying trends that aren't great in these areas, we'd consider looking elsewhere.
On a final note, we found 2 warning signs for Medifast (1 is a bit concerning) you should be aware of.
High returns are a key ingredient to strong performance, so check out our free list ofstocks earning high returns on equity with solid balance sheets.
Have feedback on this article? Concerned about the content? Get in touch with us directly. Alternatively, email editorial-team (at) simplywallst.com.
This article by Simply Wall St is general in nature. We provide commentary based on historical data and analyst forecasts only using an unbiased methodology and our articles are not intended to be financial advice. It does not constitute a recommendation to buy or sell any stock, and does not take account of your objectives, or your financial situation. We aim to bring you long-term focused analysis driven by fundamental data. Note that our analysis may not factor in the latest price-sensitive company announcements or qualitative material. Simply Wall St has no position in any stocks mentioned.
