
 Yahoo Finance
 Investors Could Be Concerned With Latham Group's (NASDAQ:SWIM) Returns On Capital
Finding a business that has the potential to grow substantially is not easy, but it is possible if we look at a few key financial metrics. Amongst other things, we'll want to see two things; firstly, a growing return on capital employed (ROCE) and secondly, an expansion in the company's amount of capital employed. This shows us that it's a compounding machine, able to continually reinvest its earnings back into the business and generate higher returns. Although, when we looked at Latham Group (NASDAQ:SWIM), it didn't seem to tick all of these boxes.
Understanding Return On Capital Employed (ROCE)
Just to clarify if you're unsure, ROCE is a metric for evaluating how much pre-tax income (in percentage terms) a company earns on the capital invested in its business. The formula for this calculation on Latham Group is:
Return on Capital Employed = Earnings Before Interest and Tax (EBIT) ÷ (Total Assets - Current Liabilities)
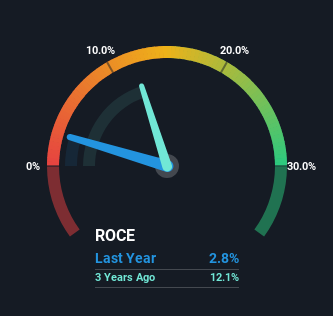
0.028 = US$20m ÷ (US$809m - US$71m) (Based on the trailing twelve months to March 2024).
Therefore, Latham Group has an ROCE of 2.8%. Ultimately, that's a low return and it under-performs the Leisure industry average of 13%.
Check out our latest analysis for Latham Group
In the above chart we have measured Latham Group's prior ROCE against its prior performance, but the future is arguably more important. If you're interested, you can view the analysts predictions in our free analyst report for Latham Group .
What Can We Tell From Latham Group's ROCE Trend?
On the surface, the trend of ROCE at Latham Group doesn't inspire confidence. To be more specific, ROCE has fallen from 5.8% over the last four years. And considering revenue has dropped while employing more capital, we'd be cautious. This could mean that the business is losing its competitive advantage or market share, because while more money is being put into ventures, it's actually producing a lower return - "less bang for their buck" per se.
The Bottom Line On Latham Group's ROCE
We're a bit apprehensive about Latham Group because despite more capital being deployed in the business, returns on that capital and sales have both fallen. We expect this has contributed to the stock plummeting 89% during the last three years. Unless there is a shift to a more positive trajectory in these metrics, we would look elsewhere.
Latham Group does have some risks, we noticed 3 warning signs (and 2 which are a bit concerning) we think you should know about.
While Latham Group may not currently earn the highest returns, we've compiled a list of companies that currently earn more than 25% return on equity. Check out this free list here.
Have feedback on this article? Concerned about the content? Get in touch with us directly. Alternatively, email editorial-team (at) simplywallst.com.
This article by Simply Wall St is general in nature. We provide commentary based on historical data and analyst forecasts only using an unbiased methodology and our articles are not intended to be financial advice. It does not constitute a recommendation to buy or sell any stock, and does not take account of your objectives, or your financial situation. We aim to bring you long-term focused analysis driven by fundamental data. Note that our analysis may not factor in the latest price-sensitive company announcements or qualitative material. Simply Wall St has no position in any stocks mentioned.
Have feedback on this article? Concerned about the content? Get in touch with us directly. Alternatively, email editorial-team@simplywallst.com
