
 Yahoo Finance
 Investors Could Be Concerned With Huadi International Group's (NASDAQ:HUDI) Returns On Capital
Did you know there are some financial metrics that can provide clues of a potential multi-bagger? Amongst other things, we'll want to see two things; firstly, a growing return on capital employed (ROCE) and secondly, an expansion in the company's amount of capital employed. Ultimately, this demonstrates that it's a business that is reinvesting profits at increasing rates of return. In light of that, when we looked at Huadi International Group (NASDAQ:HUDI) and its ROCE trend, we weren't exactly thrilled.
Understanding Return On Capital Employed (ROCE)
If you haven't worked with ROCE before, it measures the 'return' (pre-tax profit) a company generates from capital employed in its business. Analysts use this formula to calculate it for Huadi International Group:
Return on Capital Employed = Earnings Before Interest and Tax (EBIT) ÷ (Total Assets - Current Liabilities)
0.031 = US$2.5m ÷ (US$103m - US$23m) (Based on the trailing twelve months to September 2023).
Thus, Huadi International Group has an ROCE of 3.1%. Ultimately, that's a low return and it under-performs the Metals and Mining industry average of 9.4%.
See our latest analysis for Huadi International Group
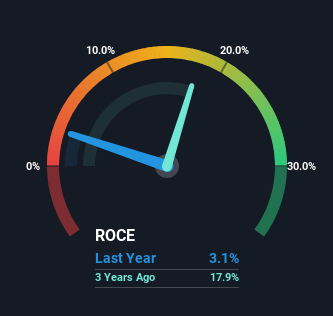
Historical performance is a great place to start when researching a stock so above you can see the gauge for Huadi International Group's ROCE against it's prior returns. If you'd like to look at how Huadi International Group has performed in the past in other metrics, you can view this free graph of Huadi International Group's past earnings, revenue and cash flow.
What Does the ROCE Trend For Huadi International Group Tell Us?
On the surface, the trend of ROCE at Huadi International Group doesn't inspire confidence. Around five years ago the returns on capital were 49%, but since then they've fallen to 3.1%. Although, given both revenue and the amount of assets employed in the business have increased, it could suggest the company is investing in growth, and the extra capital has led to a short-term reduction in ROCE. If these investments prove successful, this can bode very well for long term stock performance.
On a side note, Huadi International Group has done well to pay down its current liabilities to 22% of total assets. Since the ratio used to be 78%, that's a significant reduction and it no doubt explains the drop in ROCE. What's more, this can reduce some aspects of risk to the business because now the company's suppliers or short-term creditors are funding less of its operations. Some would claim this reduces the business' efficiency at generating ROCE since it is now funding more of the operations with its own money.
In Conclusion...
In summary, despite lower returns in the short term, we're encouraged to see that Huadi International Group is reinvesting for growth and has higher sales as a result. These growth trends haven't led to growth returns though, since the stock has fallen 49% over the last three years. So we think it'd be worthwhile to look further into this stock given the trends look encouraging.
On a final note, we found 3 warning signs for Huadi International Group (1 is a bit concerning) you should be aware of.
For those who like to invest in solid companies, check out this free list of companies with solid balance sheets and high returns on equity.
Have feedback on this article? Concerned about the content? Get in touch with us directly. Alternatively, email editorial-team (at) simplywallst.com.
This article by Simply Wall St is general in nature. We provide commentary based on historical data and analyst forecasts only using an unbiased methodology and our articles are not intended to be financial advice. It does not constitute a recommendation to buy or sell any stock, and does not take account of your objectives, or your financial situation. We aim to bring you long-term focused analysis driven by fundamental data. Note that our analysis may not factor in the latest price-sensitive company announcements or qualitative material. Simply Wall St has no position in any stocks mentioned.
