
 Yahoo Finance
 Investing in PTC (NASDAQ:PTC) five years ago would have delivered you a 95% gain
When we invest, we're generally looking for stocks that outperform the market average. And the truth is, you can make significant gains if you buy good quality businesses at the right price. For example, the PTC Inc. (NASDAQ:PTC) share price is up 95% in the last 5 years, clearly besting the market return of around 76% (ignoring dividends). On the other hand, the more recent gains haven't been so impressive, with shareholders gaining just 21%.
With that in mind, it's worth seeing if the company's underlying fundamentals have been the driver of long term performance, or if there are some discrepancies.
View our latest analysis for PTC
To quote Buffett, 'Ships will sail around the world but the Flat Earth Society will flourish. There will continue to be wide discrepancies between price and value in the marketplace...' One way to examine how market sentiment has changed over time is to look at the interaction between a company's share price and its earnings per share (EPS).
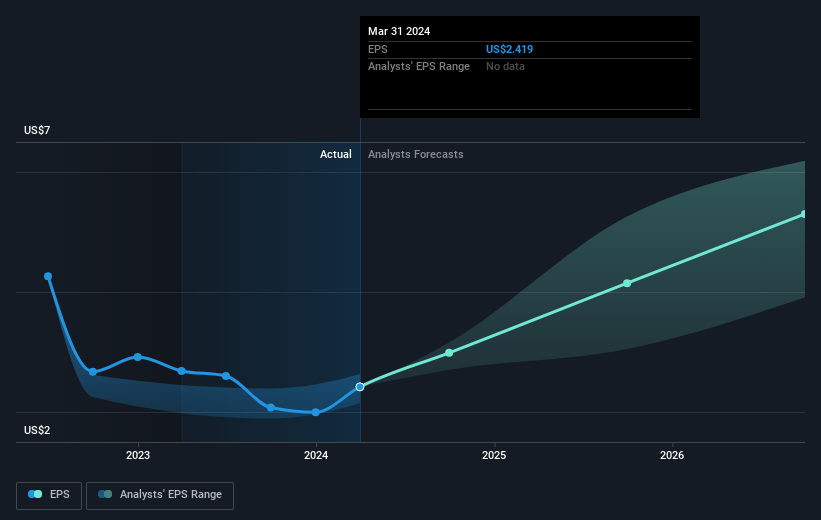
Over half a decade, PTC managed to grow its earnings per share at 106% a year. The EPS growth is more impressive than the yearly share price gain of 14% over the same period. So one could conclude that the broader market has become more cautious towards the stock. Having said that, the market is still optimistic, given the P/E ratio of 72.50.
The graphic below depicts how EPS has changed over time (unveil the exact values by clicking on the image).
It might be well worthwhile taking a look at our free report on PTC's earnings, revenue and cash flow.
A Different Perspective
PTC shareholders have received returns of 21% over twelve months, which isn't far from the general market return. Most would be happy with a gain, and it helps that the year's return is actually better than the average return over five years, which was 14%. Even if the share price growth slows down from here, there's a good chance that this is business worth watching in the long term. It's always interesting to track share price performance over the longer term. But to understand PTC better, we need to consider many other factors. Take risks, for example - PTC has 2 warning signs we think you should be aware of.
We will like PTC better if we see some big insider buys. While we wait, check out this free list of undervalued stocks (mostly small caps) with considerable, recent, insider buying.
Please note, the market returns quoted in this article reflect the market weighted average returns of stocks that currently trade on American exchanges.
Have feedback on this article? Concerned about the content? Get in touch with us directly. Alternatively, email editorial-team (at) simplywallst.com.
This article by Simply Wall St is general in nature. We provide commentary based on historical data and analyst forecasts only using an unbiased methodology and our articles are not intended to be financial advice. It does not constitute a recommendation to buy or sell any stock, and does not take account of your objectives, or your financial situation. We aim to bring you long-term focused analysis driven by fundamental data. Note that our analysis may not factor in the latest price-sensitive company announcements or qualitative material. Simply Wall St has no position in any stocks mentioned.
Have feedback on this article? Concerned about the content? Get in touch with us directly. Alternatively, email editorial-team@simplywallst.com
