
 Yahoo Finance
 Here's What's Concerning About Scotts Miracle-Gro's (NYSE:SMG) Returns On Capital
When we're researching a company, it's sometimes hard to find the warning signs, but there are some financial metrics that can help spot trouble early. A business that's potentially in decline often shows two trends, a return on capital employed (ROCE) that's declining, and a base of capital employed that's also declining. This reveals that the company isn't compounding shareholder wealth because returns are falling and its net asset base is shrinking. On that note, looking into Scotts Miracle-Gro (NYSE:SMG), we weren't too upbeat about how things were going.
What Is Return On Capital Employed (ROCE)?
Just to clarify if you're unsure, ROCE is a metric for evaluating how much pre-tax income (in percentage terms) a company earns on the capital invested in its business. Analysts use this formula to calculate it for Scotts Miracle-Gro:
Return on Capital Employed = Earnings Before Interest and Tax (EBIT) ÷ (Total Assets - Current Liabilities)
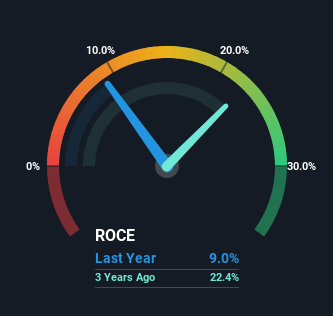
0.09 = US$259m ÷ (US$3.9b - US$1.1b) (Based on the trailing twelve months to March 2024).
So, Scotts Miracle-Gro has an ROCE of 9.0%. Even though it's in line with the industry average of 8.8%, it's still a low return by itself.
See our latest analysis for Scotts Miracle-Gro
Above you can see how the current ROCE for Scotts Miracle-Gro compares to its prior returns on capital, but there's only so much you can tell from the past. If you'd like to see what analysts are forecasting going forward, you should check out our free analyst report for Scotts Miracle-Gro .
How Are Returns Trending?
We are a bit worried about the trend of returns on capital at Scotts Miracle-Gro. Unfortunately the returns on capital have diminished from the 14% that they were earning five years ago. On top of that, it's worth noting that the amount of capital employed within the business has remained relatively steady. Since returns are falling and the business has the same amount of assets employed, this can suggest it's a mature business that hasn't had much growth in the last five years. So because these trends aren't typically conducive to creating a multi-bagger, we wouldn't hold our breath on Scotts Miracle-Gro becoming one if things continue as they have.
In Conclusion...
In summary, it's unfortunate that Scotts Miracle-Gro is generating lower returns from the same amount of capital. It should come as no surprise then that the stock has fallen 18% over the last five years, so it looks like investors are recognizing these changes. That being the case, unless the underlying trends revert to a more positive trajectory, we'd consider looking elsewhere.
If you want to know some of the risks facing Scotts Miracle-Gro we've found 2 warning signs (1 doesn't sit too well with us!) that you should be aware of before investing here.
For those who like to invest in solid companies, check out this free list of companies with solid balance sheets and high returns on equity.
Have feedback on this article? Concerned about the content? Get in touch with us directly. Alternatively, email editorial-team (at) simplywallst.com.
This article by Simply Wall St is general in nature. We provide commentary based on historical data and analyst forecasts only using an unbiased methodology and our articles are not intended to be financial advice. It does not constitute a recommendation to buy or sell any stock, and does not take account of your objectives, or your financial situation. We aim to bring you long-term focused analysis driven by fundamental data. Note that our analysis may not factor in the latest price-sensitive company announcements or qualitative material. Simply Wall St has no position in any stocks mentioned.
