
 Yahoo Finance
 Helios Technologies (NYSE:HLIO) sheds US$158m, company earnings and investor returns have been trending downwards for past three years
In order to justify the effort of selecting individual stocks, it's worth striving to beat the returns from a market index fund. But its virtually certain that sometimes you will buy stocks that fall short of the market average returns. Unfortunately, that's been the case for longer term Helios Technologies, Inc. (NYSE:HLIO) shareholders, since the share price is down 34% in the last three years, falling well short of the market return of around 19%. The last week also saw the share price slip down another 9.0%.
If the past week is anything to go by, investor sentiment for Helios Technologies isn't positive, so let's see if there's a mismatch between fundamentals and the share price.
See our latest analysis for Helios Technologies
There is no denying that markets are sometimes efficient, but prices do not always reflect underlying business performance. One imperfect but simple way to consider how the market perception of a company has shifted is to compare the change in the earnings per share (EPS) with the share price movement.
During the three years that the share price fell, Helios Technologies' earnings per share (EPS) dropped by 16% each year. This fall in the EPS is worse than the 13% compound annual share price fall. This suggests that the market retains some optimism around long term earnings stability, despite past EPS declines. This positive sentiment is also reflected in the generous P/E ratio of 48.57.
You can see below how EPS has changed over time (discover the exact values by clicking on the image).
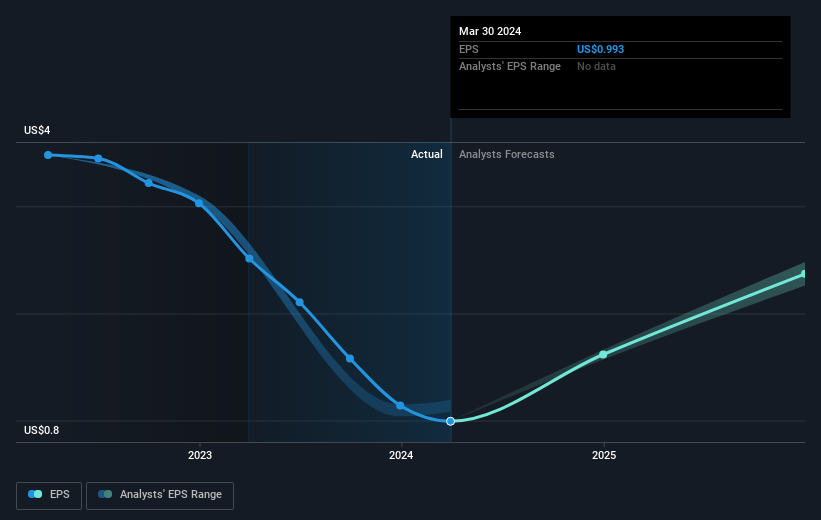
Dive deeper into Helios Technologies' key metrics by checking this interactive graph of Helios Technologies's earnings, revenue and cash flow.
A Different Perspective
Helios Technologies shareholders are down 2.3% for the year (even including dividends), but the market itself is up 27%. However, keep in mind that even the best stocks will sometimes underperform the market over a twelve month period. Longer term investors wouldn't be so upset, since they would have made 2%, each year, over five years. If the fundamental data continues to indicate long term sustainable growth, the current sell-off could be an opportunity worth considering. It's always interesting to track share price performance over the longer term. But to understand Helios Technologies better, we need to consider many other factors. For instance, we've identified 4 warning signs for Helios Technologies (1 makes us a bit uncomfortable) that you should be aware of.
If you would prefer to check out another company -- one with potentially superior financials -- then do not miss this free list of companies that have proven they can grow earnings.
Please note, the market returns quoted in this article reflect the market weighted average returns of stocks that currently trade on American exchanges.
Have feedback on this article? Concerned about the content? Get in touch with us directly. Alternatively, email editorial-team (at) simplywallst.com.
This article by Simply Wall St is general in nature. We provide commentary based on historical data and analyst forecasts only using an unbiased methodology and our articles are not intended to be financial advice. It does not constitute a recommendation to buy or sell any stock, and does not take account of your objectives, or your financial situation. We aim to bring you long-term focused analysis driven by fundamental data. Note that our analysis may not factor in the latest price-sensitive company announcements or qualitative material. Simply Wall St has no position in any stocks mentioned.
