
 Yahoo Finance
 Groupon (NASDAQ:GRPN) Could Be At Risk Of Shrinking As A Company
Ignoring the stock price of a company, what are the underlying trends that tell us a business is past the growth phase? Businesses in decline often have two underlying trends, firstly, a declining return on capital employed (ROCE) and a declining base of capital employed. Ultimately this means that the company is earning less per dollar invested and on top of that, it's shrinking its base of capital employed. So after glancing at the trends within Groupon (NASDAQ:GRPN), we weren't too hopeful.
Return On Capital Employed (ROCE): What Is It?
If you haven't worked with ROCE before, it measures the 'return' (pre-tax profit) a company generates from capital employed in its business. To calculate this metric for Groupon, this is the formula:
Return on Capital Employed = Earnings Before Interest and Tax (EBIT) ÷ (Total Assets - Current Liabilities)
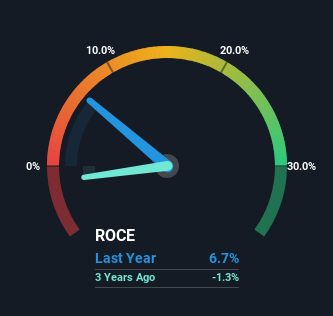
0.067 = US$19m ÷ (US$581m - US$297m) (Based on the trailing twelve months to March 2024).
Thus, Groupon has an ROCE of 6.7%. Ultimately, that's a low return and it under-performs the Multiline Retail industry average of 11%.
Check out our latest analysis for Groupon
In the above chart we have measured Groupon's prior ROCE against its prior performance, but the future is arguably more important. If you'd like to see what analysts are forecasting going forward, you should check out our free analyst report for Groupon .
What Can We Tell From Groupon's ROCE Trend?
We aren't too thrilled by the trend because ROCE has declined 46% over the last five years and despite the capital raising conducted before the latest reports, the business has -60% less capital employed.
On a separate but related note, it's important to know that Groupon has a current liabilities to total assets ratio of 51%, which we'd consider pretty high. This can bring about some risks because the company is basically operating with a rather large reliance on its suppliers or other sorts of short-term creditors. While it's not necessarily a bad thing, it can be beneficial if this ratio is lower.
The Bottom Line On Groupon's ROCE
In summary, it's unfortunate that Groupon is shrinking its capital base and also generating lower returns. We expect this has contributed to the stock plummeting 80% during the last five years. With underlying trends that aren't great in these areas, we'd consider looking elsewhere.
If you want to continue researching Groupon, you might be interested to know about the 2 warning signs that our analysis has discovered.
While Groupon may not currently earn the highest returns, we've compiled a list of companies that currently earn more than 25% return on equity. Check out this free list here.
Have feedback on this article? Concerned about the content? Get in touch with us directly. Alternatively, email editorial-team (at) simplywallst.com.
This article by Simply Wall St is general in nature. We provide commentary based on historical data and analyst forecasts only using an unbiased methodology and our articles are not intended to be financial advice. It does not constitute a recommendation to buy or sell any stock, and does not take account of your objectives, or your financial situation. We aim to bring you long-term focused analysis driven by fundamental data. Note that our analysis may not factor in the latest price-sensitive company announcements or qualitative material. Simply Wall St has no position in any stocks mentioned.
