
 Yahoo Finance
 Full Truck Alliance (NYSE:YMM) Is Experiencing Growth In Returns On Capital
If we want to find a potential multi-bagger, often there are underlying trends that can provide clues. Firstly, we'll want to see a proven return on capital employed (ROCE) that is increasing, and secondly, an expanding base of capital employed. Ultimately, this demonstrates that it's a business that is reinvesting profits at increasing rates of return. With that in mind, we've noticed some promising trends at Full Truck Alliance (NYSE:YMM) so let's look a bit deeper.
Return On Capital Employed (ROCE): What Is It?
If you haven't worked with ROCE before, it measures the 'return' (pre-tax profit) a company generates from capital employed in its business. The formula for this calculation on Full Truck Alliance is:
Return on Capital Employed = Earnings Before Interest and Tax (EBIT) ÷ (Total Assets - Current Liabilities)
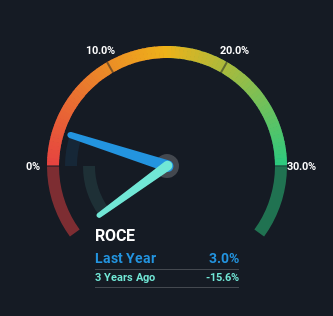
0.03 = CN¥1.1b ÷ (CN¥39b - CN¥3.3b) (Based on the trailing twelve months to December 2023).
So, Full Truck Alliance has an ROCE of 3.0%. In absolute terms, that's a low return and it also under-performs the Transportation industry average of 8.2%.
View our latest analysis for Full Truck Alliance
In the above chart we have measured Full Truck Alliance's prior ROCE against its prior performance, but the future is arguably more important. If you'd like to see what analysts are forecasting going forward, you should check out our free analyst report for Full Truck Alliance .
What Can We Tell From Full Truck Alliance's ROCE Trend?
The fact that Full Truck Alliance is now generating some pre-tax profits from its prior investments is very encouraging. The company was generating losses four years ago, but now it's earning 3.0% which is a sight for sore eyes. And unsurprisingly, like most companies trying to break into the black, Full Truck Alliance is utilizing 146% more capital than it was four years ago. We like this trend, because it tells us the company has profitable reinvestment opportunities available to it, and if it continues going forward that can lead to a multi-bagger performance.
The Key Takeaway
Long story short, we're delighted to see that Full Truck Alliance's reinvestment activities have paid off and the company is now profitable. And investors seem to expect more of this going forward, since the stock has rewarded shareholders with a 47% return over the last year. In light of that, we think it's worth looking further into this stock because if Full Truck Alliance can keep these trends up, it could have a bright future ahead.
On a final note, we've found 1 warning sign for Full Truck Alliance that we think you should be aware of.
For those who like to invest in solid companies, check out this free list of companies with solid balance sheets and high returns on equity.
Have feedback on this article? Concerned about the content? Get in touch with us directly. Alternatively, email editorial-team (at) simplywallst.com.
This article by Simply Wall St is general in nature. We provide commentary based on historical data and analyst forecasts only using an unbiased methodology and our articles are not intended to be financial advice. It does not constitute a recommendation to buy or sell any stock, and does not take account of your objectives, or your financial situation. We aim to bring you long-term focused analysis driven by fundamental data. Note that our analysis may not factor in the latest price-sensitive company announcements or qualitative material. Simply Wall St has no position in any stocks mentioned.
