
 Yahoo Finance
 Fresenius SE & Co. KGaA (ETR:FRE) Stock Is Going Strong But Fundamentals Look Uncertain: What Lies Ahead ?
Fresenius SE KGaA's (ETR:FRE) stock is up by a considerable 19% over the past three months. But the company's key financial indicators appear to be differing across the board and that makes us question whether or not the company's current share price momentum can be maintained. Particularly, we will be paying attention to Fresenius SE KGaA's ROE today.
Return on Equity or ROE is a test of how effectively a company is growing its value and managing investors’ money. Simply put, it is used to assess the profitability of a company in relation to its equity capital.
View our latest analysis for Fresenius SE KGaA
How Do You Calculate Return On Equity?
The formula for ROE is:
Return on Equity = Net Profit (from continuing operations) ÷ Shareholders' Equity
So, based on the above formula, the ROE for Fresenius SE KGaA is:
1.0% = €197m ÷ €20b (Based on the trailing twelve months to March 2024).
The 'return' is the amount earned after tax over the last twelve months. That means that for every €1 worth of shareholders' equity, the company generated €0.01 in profit.
What Is The Relationship Between ROE And Earnings Growth?
So far, we've learned that ROE is a measure of a company's profitability. Based on how much of its profits the company chooses to reinvest or "retain", we are then able to evaluate a company's future ability to generate profits. Assuming everything else remains unchanged, the higher the ROE and profit retention, the higher the growth rate of a company compared to companies that don't necessarily bear these characteristics.
Fresenius SE KGaA's Earnings Growth And 1.0% ROE
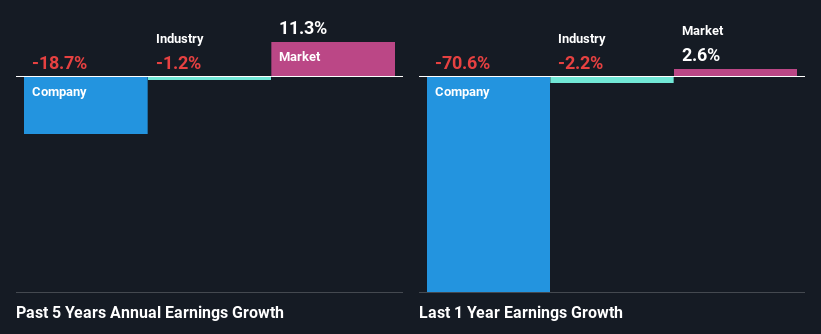
As you can see, Fresenius SE KGaA's ROE looks pretty weak. Even when compared to the industry average of 4.3%, the ROE figure is pretty disappointing. For this reason, Fresenius SE KGaA's five year net income decline of 19% is not surprising given its lower ROE. We believe that there also might be other aspects that are negatively influencing the company's earnings prospects. Such as - low earnings retention or poor allocation of capital.
As a next step, we compared Fresenius SE KGaA's performance with the industry and found thatFresenius SE KGaA's performance is depressing even when compared with the industry, which has shrunk its earnings at a rate of 1.2% in the same period, which is a slower than the company.
Earnings growth is a huge factor in stock valuation. It’s important for an investor to know whether the market has priced in the company's expected earnings growth (or decline). This then helps them determine if the stock is placed for a bright or bleak future. If you're wondering about Fresenius SE KGaA's's valuation, check out this gauge of its price-to-earnings ratio, as compared to its industry.
Is Fresenius SE KGaA Making Efficient Use Of Its Profits?
While the company did payout a portion of its dividend in the past, it currently doesn't pay a regular dividend. This implies that potentially all of its profits are being reinvested in the business.
Based on the latest analysts' estimates, we found that the company's future payout ratio over the next three years is expected to hold steady at 29%. However, Fresenius SE KGaA's ROE is predicted to rise to 8.8% despite there being no anticipated change in its payout ratio.
Summary
In total, we're a bit ambivalent about Fresenius SE KGaA's performance. While the company does have a high rate of profit retention, its low rate of return is probably hampering its earnings growth. That being so, the latest industry analyst forecasts show that the analysts are expecting to see a huge improvement in the company's earnings growth rate. To know more about the company's future earnings growth forecasts take a look at this free report on analyst forecasts for the company to find out more.
Have feedback on this article? Concerned about the content? Get in touch with us directly. Alternatively, email editorial-team (at) simplywallst.com.
This article by Simply Wall St is general in nature. We provide commentary based on historical data and analyst forecasts only using an unbiased methodology and our articles are not intended to be financial advice. It does not constitute a recommendation to buy or sell any stock, and does not take account of your objectives, or your financial situation. We aim to bring you long-term focused analysis driven by fundamental data. Note that our analysis may not factor in the latest price-sensitive company announcements or qualitative material. Simply Wall St has no position in any stocks mentioned.
