
 Yahoo Finance
 Exponent (NASDAQ:EXPO) Is Reinvesting To Multiply In Value
If you're not sure where to start when looking for the next multi-bagger, there are a few key trends you should keep an eye out for. In a perfect world, we'd like to see a company investing more capital into its business and ideally the returns earned from that capital are also increasing. This shows us that it's a compounding machine, able to continually reinvest its earnings back into the business and generate higher returns. So, when we ran our eye over Exponent's (NASDAQ:EXPO) trend of ROCE, we really liked what we saw.
Return On Capital Employed (ROCE): What Is It?
If you haven't worked with ROCE before, it measures the 'return' (pre-tax profit) a company generates from capital employed in its business. To calculate this metric for Exponent, this is the formula:
Return on Capital Employed = Earnings Before Interest and Tax (EBIT) ÷ (Total Assets - Current Liabilities)
0.22 = US$113m ÷ (US$629m - US$114m) (Based on the trailing twelve months to March 2024).
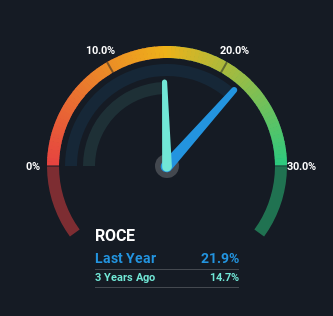
So, Exponent has an ROCE of 22%. That's a fantastic return and not only that, it outpaces the average of 14% earned by companies in a similar industry.
View our latest analysis for Exponent
Above you can see how the current ROCE for Exponent compares to its prior returns on capital, but there's only so much you can tell from the past. If you'd like, you can check out the forecasts from the analysts covering Exponent for free.
What Does the ROCE Trend For Exponent Tell Us?
It's hard not to be impressed by Exponent's returns on capital. The company has consistently earned 22% for the last five years, and the capital employed within the business has risen 24% in that time. Now considering ROCE is an attractive 22%, this combination is actually pretty appealing because it means the business can consistently put money to work and generate these high returns. If Exponent can keep this up, we'd be very optimistic about its future.
The Bottom Line On Exponent's ROCE
In summary, we're delighted to see that Exponent has been compounding returns by reinvesting at consistently high rates of return, as these are common traits of a multi-bagger. And since the stock has risen strongly over the last five years, it appears the market might expect this trend to continue. So even though the stock might be more "expensive" than it was before, we think the strong fundamentals warrant this stock for further research.
One more thing, we've spotted 1 warning sign facing Exponent that you might find interesting.
If you'd like to see other companies earning high returns, check out our free list of companies earning high returns with solid balance sheets here.
Have feedback on this article? Concerned about the content? Get in touch with us directly. Alternatively, email editorial-team (at) simplywallst.com.
This article by Simply Wall St is general in nature. We provide commentary based on historical data and analyst forecasts only using an unbiased methodology and our articles are not intended to be financial advice. It does not constitute a recommendation to buy or sell any stock, and does not take account of your objectives, or your financial situation. We aim to bring you long-term focused analysis driven by fundamental data. Note that our analysis may not factor in the latest price-sensitive company announcements or qualitative material. Simply Wall St has no position in any stocks mentioned.
