
 Yahoo Finance
 easyJet plc (LON:EZJ) Stock's Been Sliding But Fundamentals Look Decent: Will The Market Correct The Share Price In The Future?
With its stock down 10.0% over the past three months, it is easy to disregard easyJet (LON:EZJ). However, the company's fundamentals look pretty decent, and long-term financials are usually aligned with future market price movements. Specifically, we decided to study easyJet's ROE in this article.
Return on equity or ROE is an important factor to be considered by a shareholder because it tells them how effectively their capital is being reinvested. Simply put, it is used to assess the profitability of a company in relation to its equity capital.
See our latest analysis for easyJet
How To Calculate Return On Equity?
ROE can be calculated by using the formula:
Return on Equity = Net Profit (from continuing operations) ÷ Shareholders' Equity
So, based on the above formula, the ROE for easyJet is:
12% = UK£324m ÷ UK£2.8b (Based on the trailing twelve months to September 2023).
The 'return' is the amount earned after tax over the last twelve months. That means that for every £1 worth of shareholders' equity, the company generated £0.12 in profit.
What Has ROE Got To Do With Earnings Growth?
Thus far, we have learned that ROE measures how efficiently a company is generating its profits. Depending on how much of these profits the company reinvests or "retains", and how effectively it does so, we are then able to assess a company’s earnings growth potential. Assuming all else is equal, companies that have both a higher return on equity and higher profit retention are usually the ones that have a higher growth rate when compared to companies that don't have the same features.
easyJet's Earnings Growth And 12% ROE
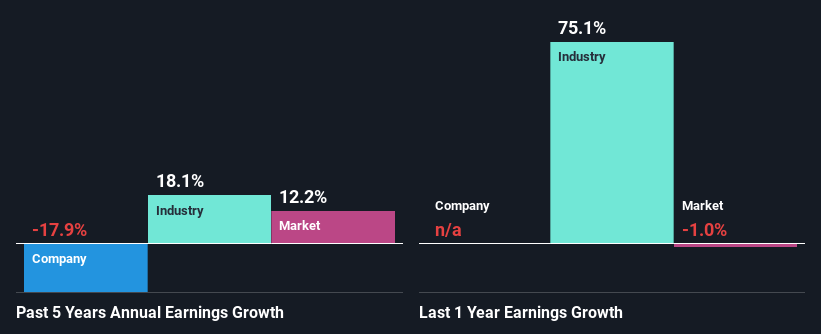
At first glance, easyJet seems to have a decent ROE. Be that as it may, the company's ROE is still quite lower than the industry average of 29%. Further research shows that easyJet's net income has shrunk at a rate of 18% over the last five years. Bear in mind, the company does have a high ROE. It is just that the industry ROE is higher. So there might be other reasons for the earnings to shrink. These include low earnings retention or poor allocation of capital.
However, when we compared easyJet's growth with the industry we found that while the company's earnings have been shrinking, the industry has seen an earnings growth of 18% in the same period. This is quite worrisome.
The basis for attaching value to a company is, to a great extent, tied to its earnings growth. The investor should try to establish if the expected growth or decline in earnings, whichever the case may be, is priced in. This then helps them determine if the stock is placed for a bright or bleak future. One good indicator of expected earnings growth is the P/E ratio which determines the price the market is willing to pay for a stock based on its earnings prospects. So, you may want to check if easyJet is trading on a high P/E or a low P/E, relative to its industry.
Is easyJet Using Its Retained Earnings Effectively?
When we piece together easyJet's low three-year median payout ratio of 10% (where it is retaining 90% of its profits), calculated for the last three-year period, we are puzzled by the lack of growth. The low payout should mean that the company is retaining most of its earnings and consequently, should see some growth. It looks like there might be some other reasons to explain the lack in that respect. For example, the business could be in decline.
Moreover, easyJet has been paying dividends for at least ten years or more suggesting that management must have perceived that the shareholders prefer dividends over earnings growth. Looking at the current analyst consensus data, we can see that the company's future payout ratio is expected to rise to 22% over the next three years. However, easyJet's future ROE is expected to rise to 15% despite the expected increase in the company's payout ratio. We infer that there could be other factors that could be driving the anticipated growth in the company's ROE.
Summary
On the whole, we do feel that easyJet has some positive attributes. However, while the company does have a decent ROE and a high profit retention, its earnings growth number is quite disappointing. This suggests that there might be some external threat to the business, that's hampering growth. With that said, we studied the latest analyst forecasts and found that while the company has shrunk its earnings in the past, analysts expect its earnings to grow in the future. To know more about the company's future earnings growth forecasts take a look at this free report on analyst forecasts for the company to find out more.
Have feedback on this article? Concerned about the content? Get in touch with us directly. Alternatively, email editorial-team (at) simplywallst.com.
This article by Simply Wall St is general in nature. We provide commentary based on historical data and analyst forecasts only using an unbiased methodology and our articles are not intended to be financial advice. It does not constitute a recommendation to buy or sell any stock, and does not take account of your objectives, or your financial situation. We aim to bring you long-term focused analysis driven by fundamental data. Note that our analysis may not factor in the latest price-sensitive company announcements or qualitative material. Simply Wall St has no position in any stocks mentioned.
