
 Yahoo Finance
 Citigroup Inc's Dividend Analysis
Exploring the Sustainability of Citigroup Inc's Dividend Payments
Citigroup Inc (NYSE:C) recently announced a dividend of $0.53 per share, payable on 2024-05-24, with the ex-dividend date set for 2024-05-03. As investors look forward to this upcoming payment, the spotlight also shines on the company's dividend history, yield, and growth rates. Using the data from GuruFocus, let's look into Citigroup Inc's dividend performance and assess its sustainability.
What Does Citigroup Inc Do?
This Powerful Chart Made Peter Lynch 29% A Year For 13 Years
How to calculate the intrinsic value of a stock?
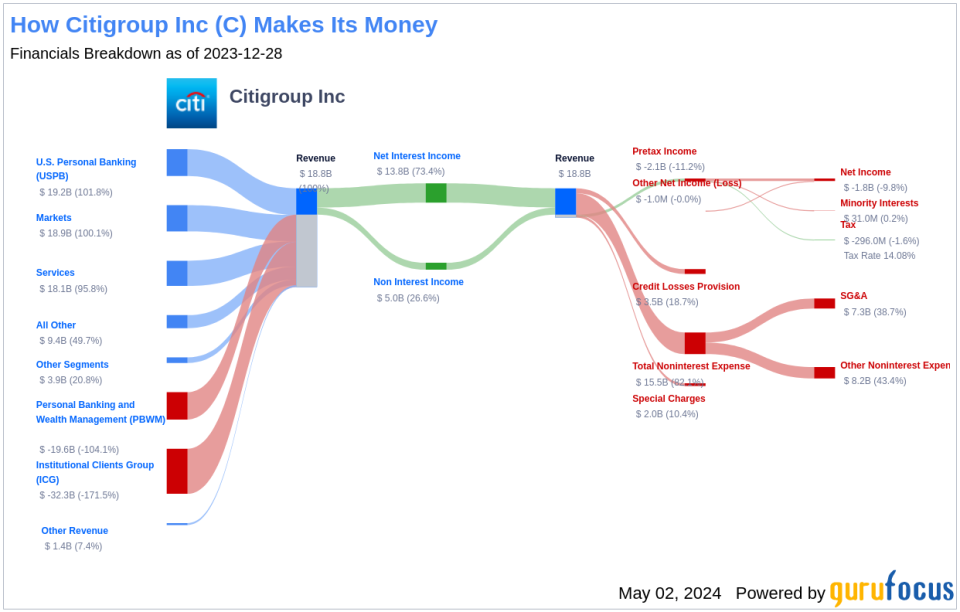
Citigroup is a global financial-services company operating in more than 100 countries and jurisdictions. Citigroup's operations are organized into five primary segments: services, markets, banking, US personal banking, and wealth management. The bank's primary services include cross-border banking needs for multinational corporates, investment banking and trading, and credit card services in the United States.
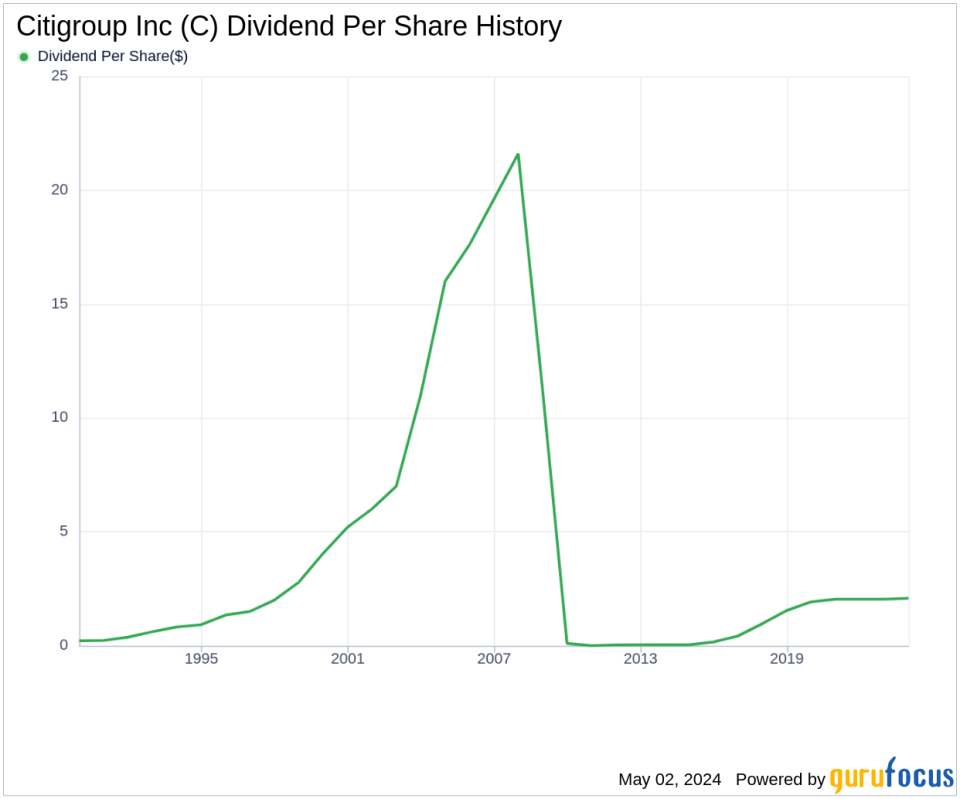
A Glimpse at Citigroup Inc's Dividend History
Citigroup Inc has maintained a consistent dividend payment record since 2011, with dividends currently distributed on a quarterly basis. Citigroup Inc has increased its dividend each year since 2011, earning it the status of a dividend achiever. This honor is given to companies that have increased their dividend each year for at least the past 13 years.
Below is a chart showing annual Dividends Per Share for tracking historical trends.
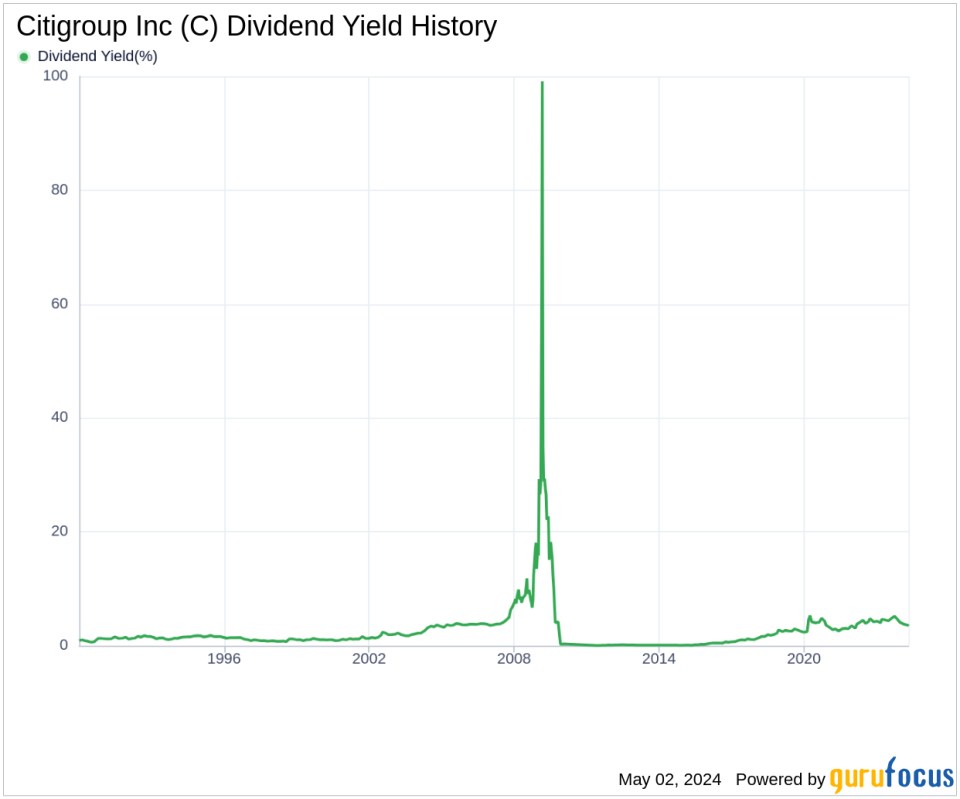
Breaking Down Citigroup Inc's Dividend Yield and Growth
As of today, Citigroup Inc currently has a 12-month trailing dividend yield of 3.41% and a 12-month forward dividend yield of 3.44%, suggesting an expectation of increased dividend payments over the next 12 months.
Over the past three years, Citigroup Inc's annual dividend growth rate was 0.60%. Extended to a five-year horizon, this rate increased to 4.90% per year. And over the past decade, Citigroup Inc's annual dividends per share growth rate stands at an impressive 53.30%.
Based on Citigroup Inc's dividend yield and five-year growth rate, the 5-year yield on cost of Citigroup Inc stock as of today is approximately 4.33%.
The Sustainability Question: Payout Ratio and Profitability
To assess the sustainability of the dividend, one needs to evaluate the company's payout ratio. The dividend payout ratio provides insights into the portion of earnings the company distributes as dividends. As of 2024-03-31, Citigroup Inc's dividend payout ratio is 0.49, suggesting a balanced approach to dividend payments and earnings retention.
Citigroup Inc's profitability rank, offers an understanding of the company's earnings prowess relative to its peers. GuruFocus ranks Citigroup Inc's profitability 5 out of 10 as of 2024-03-31, suggesting fair profitability. The company has reported net profit in 9 years out of the past 10 years.
Growth Metrics: The Future Outlook
To ensure the sustainability of dividends, a company must have robust growth metrics. Citigroup Inc's growth rank of 5 out of 10 suggests that the company has a fair growth outlook.
Revenue is the lifeblood of any company, and Citigroup Inc's revenue per share, combined with the 3-year revenue growth rate, indicates a strong revenue model. Citigroup Inc's revenue has increased by approximately 3.70% per year on average, a rate that underperforms approximately 65.41% of global competitors.
The company's 3-year EPS growth rate showcases its capability to grow its earnings, a critical component for sustaining dividends in the long run. During the past three years, Citigroup Inc's earnings increased by approximately -2.90% per year on average, a rate that underperforms approximately 81.33% of global competitors.
Lastly, the company's 5-year EBITDA growth rate of -5.00%, which underperforms approximately 88.15% of global competitors.
Conclusion and Next Steps
Considering Citigroup Inc's consistent dividend payments, growth in dividend per share, and a moderate payout ratio, the dividends appear sustainable in the near term. However, investors should keep an eye on the company's growth metrics and profitability, which are crucial for long-term sustainability. For those looking to explore further, GuruFocus Premium users can screen for high-dividend yield stocks using the High Dividend Yield Screener.
This article, generated by GuruFocus, is designed to provide general insights and is not tailored financial advice. Our commentary is rooted in historical data and analyst projections, utilizing an impartial methodology, and is not intended to serve as specific investment guidance. It does not formulate a recommendation to purchase or divest any stock and does not consider individual investment objectives or financial circumstances. Our objective is to deliver long-term, fundamental data-driven analysis. Be aware that our analysis might not incorporate the most recent, price-sensitive company announcements or qualitative information. GuruFocus holds no position in the stocks mentioned herein.
This article first appeared on GuruFocus.
