
 Yahoo Finance
 Champion Iron (ASX:CIA) Will Want To Turn Around Its Return Trends
To find a multi-bagger stock, what are the underlying trends we should look for in a business? In a perfect world, we'd like to see a company investing more capital into its business and ideally the returns earned from that capital are also increasing. If you see this, it typically means it's a company with a great business model and plenty of profitable reinvestment opportunities. So when we looked at Champion Iron (ASX:CIA), they do have a high ROCE, but we weren't exactly elated from how returns are trending.
Understanding Return On Capital Employed (ROCE)
If you haven't worked with ROCE before, it measures the 'return' (pre-tax profit) a company generates from capital employed in its business. The formula for this calculation on Champion Iron is:
Return on Capital Employed = Earnings Before Interest and Tax (EBIT) ÷ (Total Assets - Current Liabilities)
0.23 = CA$527m ÷ (CA$2.6b - CA$316m) (Based on the trailing twelve months to December 2023).
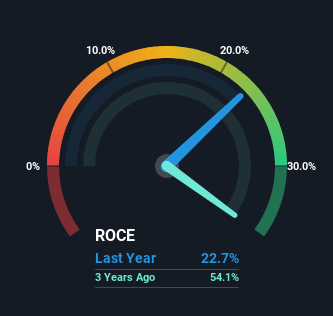
Therefore, Champion Iron has an ROCE of 23%. That's a fantastic return and not only that, it outpaces the average of 11% earned by companies in a similar industry.
See our latest analysis for Champion Iron
Above you can see how the current ROCE for Champion Iron compares to its prior returns on capital, but there's only so much you can tell from the past. If you'd like, you can check out the forecasts from the analysts covering Champion Iron for free.
What Can We Tell From Champion Iron's ROCE Trend?
In terms of Champion Iron's historical ROCE movements, the trend isn't fantastic. To be more specific, while the ROCE is still high, it's fallen from 33% where it was five years ago. However, given capital employed and revenue have both increased it appears that the business is currently pursuing growth, at the consequence of short term returns. And if the increased capital generates additional returns, the business, and thus shareholders, will benefit in the long run.
Our Take On Champion Iron's ROCE
In summary, despite lower returns in the short term, we're encouraged to see that Champion Iron is reinvesting for growth and has higher sales as a result. And the stock has done incredibly well with a 221% return over the last five years, so long term investors are no doubt ecstatic with that result. So while investors seem to be recognizing these promising trends, we would look further into this stock to make sure the other metrics justify the positive view.
One more thing to note, we've identified 1 warning sign with Champion Iron and understanding this should be part of your investment process.
High returns are a key ingredient to strong performance, so check out our free list ofstocks earning high returns on equity with solid balance sheets.
Have feedback on this article? Concerned about the content? Get in touch with us directly. Alternatively, email editorial-team (at) simplywallst.com.
This article by Simply Wall St is general in nature. We provide commentary based on historical data and analyst forecasts only using an unbiased methodology and our articles are not intended to be financial advice. It does not constitute a recommendation to buy or sell any stock, and does not take account of your objectives, or your financial situation. We aim to bring you long-term focused analysis driven by fundamental data. Note that our analysis may not factor in the latest price-sensitive company announcements or qualitative material. Simply Wall St has no position in any stocks mentioned.
