
 Yahoo Finance
 Capital Allocation Trends At Full House Resorts (NASDAQ:FLL) Aren't Ideal
If you're not sure where to start when looking for the next multi-bagger, there are a few key trends you should keep an eye out for. Typically, we'll want to notice a trend of growing return on capital employed (ROCE) and alongside that, an expanding base of capital employed. Ultimately, this demonstrates that it's a business that is reinvesting profits at increasing rates of return. Having said that, from a first glance at Full House Resorts (NASDAQ:FLL) we aren't jumping out of our chairs at how returns are trending, but let's have a deeper look.
Return On Capital Employed (ROCE): What Is It?
For those who don't know, ROCE is a measure of a company's yearly pre-tax profit (its return), relative to the capital employed in the business. The formula for this calculation on Full House Resorts is:
Return on Capital Employed = Earnings Before Interest and Tax (EBIT) ÷ (Total Assets - Current Liabilities)
0.0086 = US$5.2m ÷ (US$670m - US$63m) (Based on the trailing twelve months to March 2024).
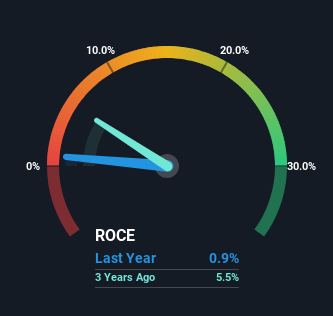
Thus, Full House Resorts has an ROCE of 0.9%. Ultimately, that's a low return and it under-performs the Hospitality industry average of 10%.
View our latest analysis for Full House Resorts
In the above chart we have measured Full House Resorts' prior ROCE against its prior performance, but the future is arguably more important. If you're interested, you can view the analysts predictions in our free analyst report for Full House Resorts .
So How Is Full House Resorts' ROCE Trending?
In terms of Full House Resorts' historical ROCE movements, the trend isn't fantastic. To be more specific, ROCE has fallen from 4.7% over the last five years. Although, given both revenue and the amount of assets employed in the business have increased, it could suggest the company is investing in growth, and the extra capital has led to a short-term reduction in ROCE. If these investments prove successful, this can bode very well for long term stock performance.
The Bottom Line On Full House Resorts' ROCE
Even though returns on capital have fallen in the short term, we find it promising that revenue and capital employed have both increased for Full House Resorts. And long term investors must be optimistic going forward because the stock has returned a huge 132% to shareholders in the last five years. So should these growth trends continue, we'd be optimistic on the stock going forward.
Full House Resorts does have some risks though, and we've spotted 1 warning sign for Full House Resorts that you might be interested in.
If you want to search for solid companies with great earnings, check out this free list of companies with good balance sheets and impressive returns on equity.
Have feedback on this article? Concerned about the content? Get in touch with us directly. Alternatively, email editorial-team (at) simplywallst.com.
This article by Simply Wall St is general in nature. We provide commentary based on historical data and analyst forecasts only using an unbiased methodology and our articles are not intended to be financial advice. It does not constitute a recommendation to buy or sell any stock, and does not take account of your objectives, or your financial situation. We aim to bring you long-term focused analysis driven by fundamental data. Note that our analysis may not factor in the latest price-sensitive company announcements or qualitative material. Simply Wall St has no position in any stocks mentioned.
