
 Yahoo Finance
 Camtek (NASDAQ:CAMT) Will Be Hoping To Turn Its Returns On Capital Around
Did you know there are some financial metrics that can provide clues of a potential multi-bagger? Firstly, we'll want to see a proven return on capital employed (ROCE) that is increasing, and secondly, an expanding base of capital employed. Basically this means that a company has profitable initiatives that it can continue to reinvest in, which is a trait of a compounding machine. However, after briefly looking over the numbers, we don't think Camtek (NASDAQ:CAMT) has the makings of a multi-bagger going forward, but let's have a look at why that may be.
Understanding Return On Capital Employed (ROCE)
If you haven't worked with ROCE before, it measures the 'return' (pre-tax profit) a company generates from capital employed in its business. To calculate this metric for Camtek, this is the formula:
Return on Capital Employed = Earnings Before Interest and Tax (EBIT) ÷ (Total Assets - Current Liabilities)
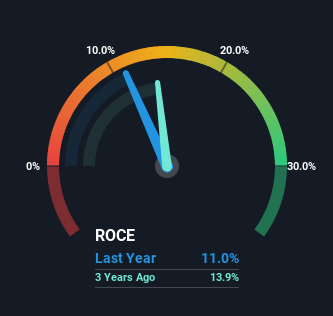
0.11 = US$72m ÷ (US$816m - US$158m) (Based on the trailing twelve months to March 2024).
Therefore, Camtek has an ROCE of 11%. That's a relatively normal return on capital, and it's around the 9.7% generated by the Semiconductor industry.
Check out our latest analysis for Camtek
In the above chart we have measured Camtek's prior ROCE against its prior performance, but the future is arguably more important. If you'd like, you can check out the forecasts from the analysts covering Camtek for free.
What Can We Tell From Camtek's ROCE Trend?
In terms of Camtek's historical ROCE movements, the trend isn't fantastic. Around five years ago the returns on capital were 21%, but since then they've fallen to 11%. However it looks like Camtek might be reinvesting for long term growth because while capital employed has increased, the company's sales haven't changed much in the last 12 months. It's worth keeping an eye on the company's earnings from here on to see if these investments do end up contributing to the bottom line.
Our Take On Camtek's ROCE
In summary, Camtek is reinvesting funds back into the business for growth but unfortunately it looks like sales haven't increased much just yet. Yet to long term shareholders the stock has gifted them an incredible 1,276% return in the last five years, so the market appears to be rosy about its future. Ultimately, if the underlying trends persist, we wouldn't hold our breath on it being a multi-bagger going forward.
On a separate note, we've found 1 warning sign for Camtek you'll probably want to know about.
While Camtek may not currently earn the highest returns, we've compiled a list of companies that currently earn more than 25% return on equity. Check out this free list here.
Have feedback on this article? Concerned about the content? Get in touch with us directly. Alternatively, email editorial-team (at) simplywallst.com.
This article by Simply Wall St is general in nature. We provide commentary based on historical data and analyst forecasts only using an unbiased methodology and our articles are not intended to be financial advice. It does not constitute a recommendation to buy or sell any stock, and does not take account of your objectives, or your financial situation. We aim to bring you long-term focused analysis driven by fundamental data. Note that our analysis may not factor in the latest price-sensitive company announcements or qualitative material. Simply Wall St has no position in any stocks mentioned.
