
 Yahoo Finance
 Camping World Holdings (NYSE:CWH) Will Be Hoping To Turn Its Returns On Capital Around
What are the early trends we should look for to identify a stock that could multiply in value over the long term? Ideally, a business will show two trends; firstly a growing return on capital employed (ROCE) and secondly, an increasing amount of capital employed. If you see this, it typically means it's a company with a great business model and plenty of profitable reinvestment opportunities. In light of that, when we looked at Camping World Holdings (NYSE:CWH) and its ROCE trend, we weren't exactly thrilled.
Return On Capital Employed (ROCE): What Is It?
For those that aren't sure what ROCE is, it measures the amount of pre-tax profits a company can generate from the capital employed in its business. Analysts use this formula to calculate it for Camping World Holdings:
Return on Capital Employed = Earnings Before Interest and Tax (EBIT) ÷ (Total Assets - Current Liabilities)
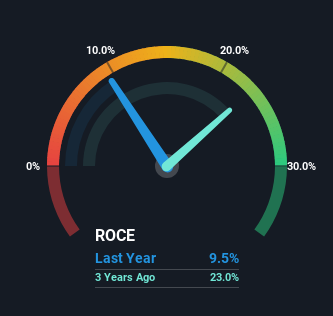
0.095 = US$275m ÷ (US$4.8b - US$1.9b) (Based on the trailing twelve months to December 2023).
Therefore, Camping World Holdings has an ROCE of 9.5%. Ultimately, that's a low return and it under-performs the Specialty Retail industry average of 13%.
Check out our latest analysis for Camping World Holdings
Above you can see how the current ROCE for Camping World Holdings compares to its prior returns on capital, but there's only so much you can tell from the past. If you're interested, you can view the analysts predictions in our free analyst report for Camping World Holdings .
What Can We Tell From Camping World Holdings' ROCE Trend?
In terms of Camping World Holdings' historical ROCE movements, the trend isn't fantastic. Around five years ago the returns on capital were 16%, but since then they've fallen to 9.5%. Given the business is employing more capital while revenue has slipped, this is a bit concerning. This could mean that the business is losing its competitive advantage or market share, because while more money is being put into ventures, it's actually producing a lower return - "less bang for their buck" per se.
Another thing to note, Camping World Holdings has a high ratio of current liabilities to total assets of 40%. This can bring about some risks because the company is basically operating with a rather large reliance on its suppliers or other sorts of short-term creditors. While it's not necessarily a bad thing, it can be beneficial if this ratio is lower.
The Bottom Line
From the above analysis, we find it rather worrisome that returns on capital and sales for Camping World Holdings have fallen, meanwhile the business is employing more capital than it was five years ago. However the stock has delivered a 91% return to shareholders over the last five years, so investors might be expecting the trends to turn around. In any case, the current underlying trends don't bode well for long term performance so unless they reverse, we'd start looking elsewhere.
If you want to know some of the risks facing Camping World Holdings we've found 4 warning signs (1 doesn't sit too well with us!) that you should be aware of before investing here.
If you want to search for solid companies with great earnings, check out this free list of companies with good balance sheets and impressive returns on equity.
Have feedback on this article? Concerned about the content? Get in touch with us directly. Alternatively, email editorial-team (at) simplywallst.com.
This article by Simply Wall St is general in nature. We provide commentary based on historical data and analyst forecasts only using an unbiased methodology and our articles are not intended to be financial advice. It does not constitute a recommendation to buy or sell any stock, and does not take account of your objectives, or your financial situation. We aim to bring you long-term focused analysis driven by fundamental data. Note that our analysis may not factor in the latest price-sensitive company announcements or qualitative material. Simply Wall St has no position in any stocks mentioned.
