
 Yahoo Finance
 Boston Properties (BXP) Q1 FFO Meet Estimates, '24 View Lowered
Boston Properties Inc.’s BXP first-quarter 2024 funds from operations (FFO) per share of $1.73 was in line with the Zacks Consensus Estimate. The reported figure remained unchanged year over year.
BXP’s quarterly results reflect better-than-anticipated revenues on healthy leasing activity. However, higher interest expenses during the quarter acted as a dampener. BXP also lowered its guidance for 2024 FFO per share.
Quarterly revenues from lease came in at $788.6 million, up 4.2% year over year. The Zacks Consensus Estimate was pegged at $768.9 million. Total revenues increased 4.5% from the prior-year quarter to $839.4 million.
Quarter in Detail
Boston Properties’ rental revenues (excluding termination income) for the office portfolio came in at $764.9 million, which rose marginally year over year. For the hotel & residential segment, the metric aggregated $20.9 million, indicating a jump of 5.3% year over year. On a consolidated basis, BXP’s rental revenues (excluding termination income) came in at $785.8 million, up marginally year over year.
BXP’s share of same property net operating income (NOI) on a cash basis (excluding termination income) totaled $443.3 million, which declined 2.9% from the prior-year quarter.
Its share of EBITDAre (on a cash basis), as of Mar 31, 2024, was $452.5 million, down 1% from $457.1 million as of Dec 31, 2023.
BXP’s in-service properties occupancy fell 20 basis points sequentially to 88.2%. We estimated the metric to be 88.1%.
BXP’s quarterly interest expenses were up 20.6% year over year to $161.9 million.
Portfolio Activity
As of Mar 31, 2024, Boston Properties’ portfolio comprised 187 properties encompassing 53.5 million square feet of space. This included 11 properties under construction/redevelopment.
During the first quarter, the company executed 61 leases aggregating 900,000 square feet with a weighted average lease term of 11.6 years.
BXP commenced the development of 121 Broadway, a residential project located in Cambridge, MA. 121 Broadway is expected to comprise 439 rental units after completion.
It closed the acquisition of its joint venture partner’s 50% economic ownership interest in 901 New York Avenue, located in Washington, DC, for $10 million. It recorded a gain on consolidation of around $21.8 million.
Boston Properties has completed the sale of a 45% interest in 290 Binney Street, a life sciences development located in Kendall Square in Cambridge, MA, to Norges Bank Investment Management (“NBIM”). As a result of this NBIM investment, the company’s share of the project’s estimated development spend over time will reduce by around $533.5 million.
Balance Sheet Position
Boston Properties exited first-quarter 2024 with cash and cash equivalents of $701.7 million, down from $1.53 billion as of Dec 31, 2023.
BXP’s share of net debt to EBITDAre annualized was 7.81 as of Mar 31, 2024, up from 7.37 times as of Dec 31, 2023.
2024 Outlook Lowered
Boston Properties projects FFO per share for second-quarter 2024 to be in the range of $1.70-$1.72.
For 2024, FFO per share is expected to be in the band of $6.98-$7.10, down from $7.00-$7.20 projected earlier. The range is lower than the Zacks Consensus Estimate of $7.12.
BXP maintained its outlook for its share of the same property NOI on a cash basis (excluding termination income) between a decrease of 3% and 1%. The average in-service portfolio occupancy remains unrevised and is expected to be in the band of 87.20-88.60% for the current year.
Boston Properties currently carries a Zacks Rank #3 (Hold). You can see the complete list of today’s Zacks #1 Rank (Strong Buy) stocks here.
Boston Properties, Inc. Price, Consensus and EPS Surprise
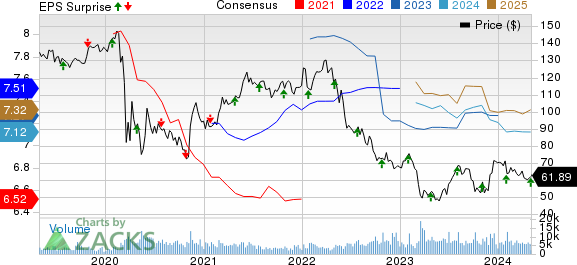
Boston Properties, Inc. price-consensus-eps-surprise-chart | Boston Properties, Inc. Quote
Performance of Other REITs
Alexandria Real Estate Equities, Inc. ARE reported first-quarter 2024 adjusted funds from operations (AFFO) per share of $2.35 yesterday, which beat the Zacks Consensus Estimate of $2.31. The reported figure also climbed 7.3% from the year-ago quarter.
Results reflected a rise in revenues, aided by decent leasing activity and rental rate growth. ARE also narrowed its 2024 outlook.
SL Green Realty Corp. SLG reported first-quarter 2024 FFO per share of $3.07, outpacing the Zacks Consensus Estimate of $2.17 per share. The figure gained significantly from the year-ago quarter’s $1.53.
Results reflect decent leasing activity in its Manhattan portfolio. However, lower rental revenues and occupancy in Manhattan’s same-store office portfolio acted as a dampener. SLG raised its guidance for 2024 FFO per share.
Note: Anything related to earnings presented in this write-up represents FFO, a widely used metric to gauge the performance of REITs.
Want the latest recommendations from Zacks Investment Research? Today, you can download 7 Best Stocks for the Next 30 Days. Click to get this free report
Boston Properties, Inc. (BXP) : Free Stock Analysis Report
SL Green Realty Corporation (SLG) : Free Stock Analysis Report
Alexandria Real Estate Equities, Inc. (ARE) : Free Stock Analysis Report
