
 Yahoo Finance
 Zoomd Technologies (CVE:ZOMD) Shareholders Will Want The ROCE Trajectory To Continue
To find a multi-bagger stock, what are the underlying trends we should look for in a business? Firstly, we'd want to identify a growing return on capital employed (ROCE) and then alongside that, an ever-increasing base of capital employed. Ultimately, this demonstrates that it's a business that is reinvesting profits at increasing rates of return. So when we looked at Zoomd Technologies (CVE:ZOMD) and its trend of ROCE, we really liked what we saw.
What Is Return On Capital Employed (ROCE)?
For those who don't know, ROCE is a measure of a company's yearly pre-tax profit (its return), relative to the capital employed in the business. To calculate this metric for Zoomd Technologies, this is the formula:
Return on Capital Employed = Earnings Before Interest and Tax (EBIT) ÷ (Total Assets - Current Liabilities)
0.00044 = US$5.0k ÷ (US$19m - US$7.9m) (Based on the trailing twelve months to March 2024).
Thus, Zoomd Technologies has an ROCE of 0.04%. In absolute terms, that's a low return and it also under-performs the Software industry average of 13%.
View our latest analysis for Zoomd Technologies
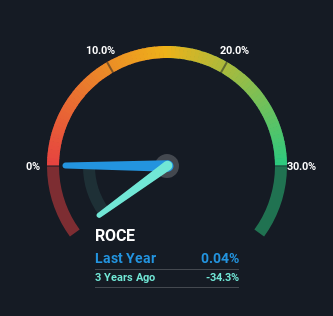
Historical performance is a great place to start when researching a stock so above you can see the gauge for Zoomd Technologies' ROCE against it's prior returns. If you're interested in investigating Zoomd Technologies' past further, check out this free graph covering Zoomd Technologies' past earnings, revenue and cash flow.
The Trend Of ROCE
Zoomd Technologies has broken into the black (profitability) and we're sure it's a sight for sore eyes. While the business was unprofitable in the past, it's now turned things around and is earning 0.04% on its capital. On top of that, what's interesting is that the amount of capital being employed has remained steady, so the business hasn't needed to put any additional money to work to generate these higher returns. So while we're happy that the business is more efficient, just keep in mind that could mean that going forward the business is lacking areas to invest internally for growth. Because in the end, a business can only get so efficient.
On a separate but related note, it's important to know that Zoomd Technologies has a current liabilities to total assets ratio of 41%, which we'd consider pretty high. This effectively means that suppliers (or short-term creditors) are funding a large portion of the business, so just be aware that this can introduce some elements of risk. Ideally we'd like to see this reduce as that would mean fewer obligations bearing risks.
The Bottom Line On Zoomd Technologies' ROCE
To bring it all together, Zoomd Technologies has done well to increase the returns it's generating from its capital employed. However the stock is down a substantial 75% in the last three years so there could be other areas of the business hurting its prospects. Regardless, we think the underlying fundamentals warrant this stock for further investigation.
One more thing to note, we've identified 2 warning signs with Zoomd Technologies and understanding them should be part of your investment process.
If you want to search for solid companies with great earnings, check out this free list of companies with good balance sheets and impressive returns on equity.
Have feedback on this article? Concerned about the content? Get in touch with us directly. Alternatively, email editorial-team (at) simplywallst.com.
This article by Simply Wall St is general in nature. We provide commentary based on historical data and analyst forecasts only using an unbiased methodology and our articles are not intended to be financial advice. It does not constitute a recommendation to buy or sell any stock, and does not take account of your objectives, or your financial situation. We aim to bring you long-term focused analysis driven by fundamental data. Note that our analysis may not factor in the latest price-sensitive company announcements or qualitative material. Simply Wall St has no position in any stocks mentioned.
