
 Yahoo Finance
 Xybion Digital (CVE:XYBN) Will Be Hoping To Turn Its Returns On Capital Around
If you're not sure where to start when looking for the next multi-bagger, there are a few key trends you should keep an eye out for. Firstly, we'll want to see a proven return on capital employed (ROCE) that is increasing, and secondly, an expanding base of capital employed. This shows us that it's a compounding machine, able to continually reinvest its earnings back into the business and generate higher returns. Although, when we looked at Xybion Digital (CVE:XYBN), it didn't seem to tick all of these boxes.
What Is Return On Capital Employed (ROCE)?
If you haven't worked with ROCE before, it measures the 'return' (pre-tax profit) a company generates from capital employed in its business. Analysts use this formula to calculate it for Xybion Digital:
Return on Capital Employed = Earnings Before Interest and Tax (EBIT) ÷ (Total Assets - Current Liabilities)
0.14 = US$2.9m ÷ (US$30m - US$9.6m) (Based on the trailing twelve months to December 2023).
Therefore, Xybion Digital has an ROCE of 14%. In absolute terms, that's a satisfactory return, but compared to the Healthcare Services industry average of 6.6% it's much better.
Check out our latest analysis for Xybion Digital
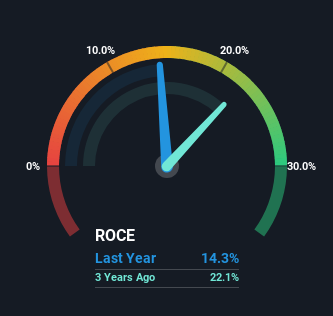
Historical performance is a great place to start when researching a stock so above you can see the gauge for Xybion Digital's ROCE against it's prior returns. If you'd like to look at how Xybion Digital has performed in the past in other metrics, you can view this free graph of Xybion Digital's past earnings, revenue and cash flow.
The Trend Of ROCE
In terms of Xybion Digital's historical ROCE movements, the trend isn't fantastic. To be more specific, ROCE has fallen from 29% over the last four years. Meanwhile, the business is utilizing more capital but this hasn't moved the needle much in terms of sales in the past 12 months, so this could reflect longer term investments. It may take some time before the company starts to see any change in earnings from these investments.
On a related note, Xybion Digital has decreased its current liabilities to 32% of total assets. So we could link some of this to the decrease in ROCE. Effectively this means their suppliers or short-term creditors are funding less of the business, which reduces some elements of risk. Some would claim this reduces the business' efficiency at generating ROCE since it is now funding more of the operations with its own money.
The Bottom Line On Xybion Digital's ROCE
Bringing it all together, while we're somewhat encouraged by Xybion Digital's reinvestment in its own business, we're aware that returns are shrinking. It seems that investors have little hope of these trends getting any better and that may have partly contributed to the stock collapsing 76% in the last year. Therefore based on the analysis done in this article, we don't think Xybion Digital has the makings of a multi-bagger.
Xybion Digital does have some risks, we noticed 4 warning signs (and 2 which are significant) we think you should know about.
For those who like to invest in solid companies, check out this free list of companies with solid balance sheets and high returns on equity.
Have feedback on this article? Concerned about the content? Get in touch with us directly. Alternatively, email editorial-team (at) simplywallst.com.
This article by Simply Wall St is general in nature. We provide commentary based on historical data and analyst forecasts only using an unbiased methodology and our articles are not intended to be financial advice. It does not constitute a recommendation to buy or sell any stock, and does not take account of your objectives, or your financial situation. We aim to bring you long-term focused analysis driven by fundamental data. Note that our analysis may not factor in the latest price-sensitive company announcements or qualitative material. Simply Wall St has no position in any stocks mentioned.
