
 Yahoo Finance
 XPEL's (NASDAQ:XPEL) five-year total shareholder returns outpace the underlying earnings growth
The XPEL, Inc. (NASDAQ:XPEL) share price has had a bad week, falling 11%. But that does not change the realty that the stock's performance has been terrific, over five years. To be precise, the stock price is 990% higher than it was five years ago, a wonderful performance by any measure. Arguably, the recent fall is to be expected after such a strong rise. Only time will tell if there is still too much optimism currently reflected in the share price. While the long term returns are impressive, we do have some sympathy for those who bought more recently, given the 28% drop, in the last year. Anyone who held for that rewarding ride would probably be keen to talk about it.
While this past week has detracted from the company's five-year return, let's look at the recent trends of the underlying business and see if the gains have been in alignment.
See our latest analysis for XPEL
To quote Buffett, 'Ships will sail around the world but the Flat Earth Society will flourish. There will continue to be wide discrepancies between price and value in the marketplace...' One imperfect but simple way to consider how the market perception of a company has shifted is to compare the change in the earnings per share (EPS) with the share price movement.
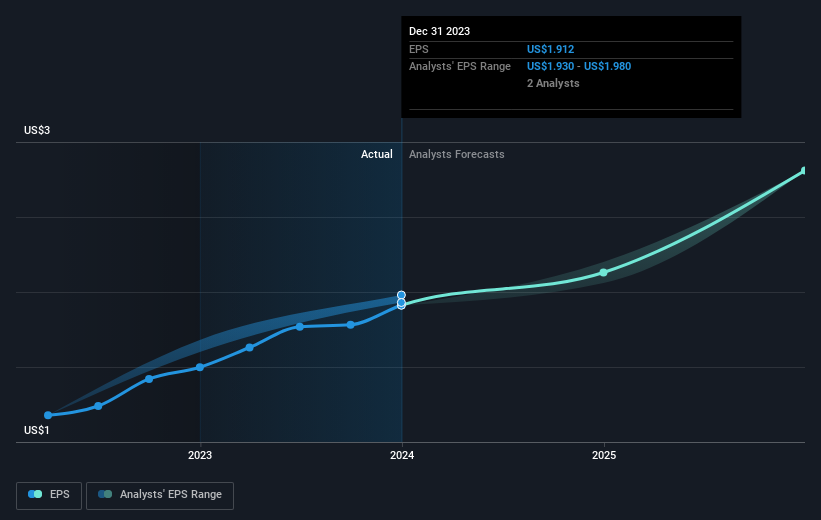
Over half a decade, XPEL managed to grow its earnings per share at 43% a year. This EPS growth is slower than the share price growth of 61% per year, over the same period. So it's fair to assume the market has a higher opinion of the business than it did five years ago. That's not necessarily surprising considering the five-year track record of earnings growth.
The company's earnings per share (over time) is depicted in the image below (click to see the exact numbers).
We're pleased to report that the CEO is remunerated more modestly than most CEOs at similarly capitalized companies. But while CEO remuneration is always worth checking, the really important question is whether the company can grow earnings going forward. Dive deeper into the earnings by checking this interactive graph of XPEL's earnings, revenue and cash flow.
A Different Perspective
While the broader market gained around 23% in the last year, XPEL shareholders lost 28%. However, keep in mind that even the best stocks will sometimes underperform the market over a twelve month period. On the bright side, long term shareholders have made money, with a gain of 61% per year over half a decade. If the fundamental data continues to indicate long term sustainable growth, the current sell-off could be an opportunity worth considering. If you would like to research XPEL in more detail then you might want to take a look at whether insiders have been buying or selling shares in the company.
If you are like me, then you will not want to miss this free list of growing companies that insiders are buying.
Please note, the market returns quoted in this article reflect the market weighted average returns of stocks that currently trade on American exchanges.
Have feedback on this article? Concerned about the content? Get in touch with us directly. Alternatively, email editorial-team (at) simplywallst.com.
This article by Simply Wall St is general in nature. We provide commentary based on historical data and analyst forecasts only using an unbiased methodology and our articles are not intended to be financial advice. It does not constitute a recommendation to buy or sell any stock, and does not take account of your objectives, or your financial situation. We aim to bring you long-term focused analysis driven by fundamental data. Note that our analysis may not factor in the latest price-sensitive company announcements or qualitative material. Simply Wall St has no position in any stocks mentioned.
