
 Yahoo Finance
 The WSP Global (TSE:WSP) Share Price Is Up 91% And Shareholders Are Holding On

Want to participate in a short research study? Help shape the future of investing tools and you could win a $250 gift card!
When we invest, we're generally looking for stocks that outperform the market average. And while active stock picking involves risks (and requires diversification) it can also provide excess returns. For example, the WSP Global Inc. (TSE:WSP) share price is up 91% in the last 5 years, clearly besting than the market return of around 5.9% (ignoring dividends). On the other hand, the more recent gains haven't been so impressive, with shareholders gaining just 17%, including dividends.
See our latest analysis for WSP Global
In his essay The Superinvestors of Graham-and-Doddsville Warren Buffett described how share prices do not always rationally reflect the value of a business. One flawed but reasonable way to assess how sentiment around a company has changed is to compare the earnings per share (EPS) with the share price.
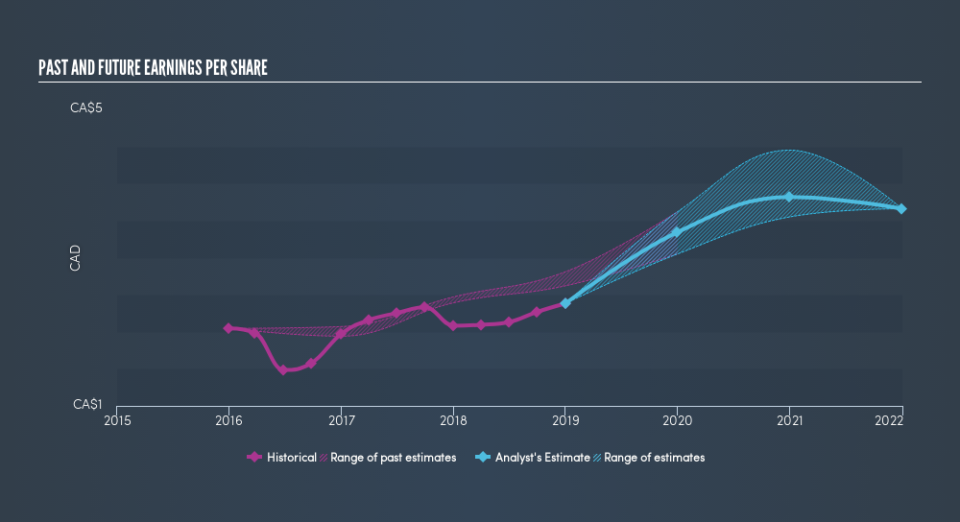
During five years of share price growth, WSP Global achieved compound earnings per share (EPS) growth of 11% per year. So the EPS growth rate is rather close to the annualized share price gain of 14% per year. That suggests that the market sentiment around the company hasn't changed much over that time. In fact, the share price seems to largely reflect the EPS growth.
The company's earnings per share (over time) is depicted in the image below (click to see the exact numbers).
We know that WSP Global has improved its bottom line lately, but is it going to grow revenue? You could check out this free report showing analyst revenue forecasts.
What About Dividends?
As well as measuring the share price return, investors should also consider the total shareholder return (TSR). The TSR incorporates the value of any spin-offs or discounted capital raisings, along with any dividends, based on the assumption that the dividends are reinvested. It's fair to say that the TSR gives a more complete picture for stocks that pay a dividend. As it happens, WSP Global's TSR for the last 5 years was 124%, which exceeds the share price return mentioned earlier. The dividends paid by the company have thusly boosted the total shareholder return.
A Different Perspective
We're pleased to report that WSP Global shareholders have received a total shareholder return of 17% over one year. That's including the dividend. Having said that, the five-year TSR of 17% a year, is even better. Before forming an opinion on WSP Global you might want to consider these 3 valuation metrics.
But note: WSP Global may not be the best stock to buy. So take a peek at this free list of interesting companies with past earnings growth (and further growth forecast).
Please note, the market returns quoted in this article reflect the market weighted average returns of stocks that currently trade on CA exchanges.
We aim to bring you long-term focused research analysis driven by fundamental data. Note that our analysis may not factor in the latest price-sensitive company announcements or qualitative material.
If you spot an error that warrants correction, please contact the editor at editorial-team@simplywallst.com. This article by Simply Wall St is general in nature. It does not constitute a recommendation to buy or sell any stock, and does not take account of your objectives, or your financial situation. Simply Wall St has no position in the stocks mentioned. Thank you for reading.
