
 Yahoo Finance
 Should We Worry About WSP Global Inc.’s (TSE:WSP) P/E Ratio?

Want to participate in a short research study? Help shape the future of investing tools and you could win a $250 gift card!
The goal of this article is to teach you how to use price to earnings ratios (P/E ratios). We’ll look at WSP Global Inc.’s (TSE:WSP) P/E ratio and reflect on what it tells us about the company’s share price. WSP Global has a price to earnings ratio of 30.25, based on the last twelve months. That corresponds to an earnings yield of approximately 3.3%.
See our latest analysis for WSP Global
How Do You Calculate A P/E Ratio?
The formula for P/E is:
Price to Earnings Ratio = Share Price ÷ Earnings per Share (EPS)
Or for WSP Global:
P/E of 30.25 = CA$68.61 ÷ CA$2.27 (Based on the trailing twelve months to September 2018.)
Is A High P/E Ratio Good?
A higher P/E ratio means that buyers have to pay a higher price for each CA$1 the company has earned over the last year. All else being equal, it’s better to pay a low price — but as Warren Buffett said, ‘It’s far better to buy a wonderful company at a fair price than a fair company at a wonderful price.’
How Growth Rates Impact P/E Ratios
Earnings growth rates have a big influence on P/E ratios. When earnings grow, the ‘E’ increases, over time. Therefore, even if you pay a high multiple of earnings now, that multiple will become lower in the future. So while a stock may look expensive based on past earnings, it could be cheap based on future earnings.
WSP Global’s earnings per share fell by 2.8% in the last twelve months. But EPS is up 11% over the last 5 years.
How Does WSP Global’s P/E Ratio Compare To Its Peers?
We can get an indication of market expectations by looking at the P/E ratio. The image below shows that WSP Global has a higher P/E than the average (17.7) P/E for companies in the construction industry.
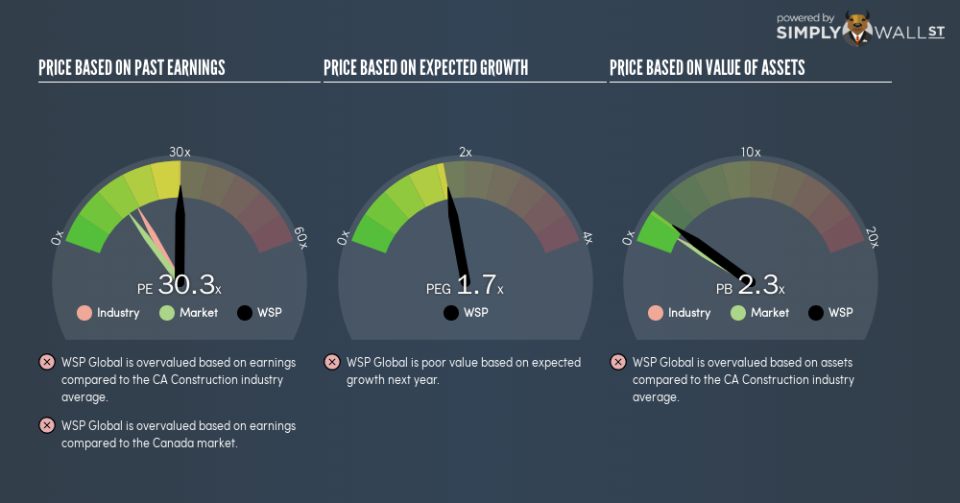
WSP Global’s P/E tells us that market participants think the company will perform better than its industry peers, going forward. The market is optimistic about the future, but that doesn’t guarantee future growth. So investors should always consider the P/E ratio alongside other factors, such as whether company directors have been buying shares.
Don’t Forget: The P/E Does Not Account For Debt or Bank Deposits
Don’t forget that the P/E ratio considers market capitalization. Thus, the metric does not reflect cash or debt held by the company. Theoretically, a business can improve its earnings (and produce a lower P/E in the future), by taking on debt (or spending its remaining cash).
Such spending might be good or bad, overall, but the key point here is that you need to look at debt to understand the P/E ratio in context.
WSP Global’s Balance Sheet
Net debt totals 13% of WSP Global’s market cap. That’s enough debt to impact the P/E ratio a little; so keep it in mind if you’re comparing it to companies without debt.
The Verdict On WSP Global’s P/E Ratio
WSP Global’s P/E is 30.3 which is above average (14.9) in the CA market. With a bit of debt, but a lack of recent growth, it’s safe to say the market is expecting improved profit performance from the company, in the next few years.
Investors have an opportunity when market expectations about a stock are wrong. As value investor Benjamin Graham famously said, ‘In the short run, the market is a voting machine but in the long run, it is a weighing machine.’ So this free report on the analyst consensus forecasts could help you make a master move on this stock.
Of course, you might find a fantastic investment by looking at a few good candidates. So take a peek at this free list of companies with modest (or no) debt, trading on a P/E below 20.
To help readers see past the short term volatility of the financial market, we aim to bring you a long-term focused research analysis purely driven by fundamental data. Note that our analysis does not factor in the latest price-sensitive company announcements.
The author is an independent contributor and at the time of publication had no position in the stocks mentioned. For errors that warrant correction please contact the editor at editorial-team@simplywallst.com.
