
 Yahoo Finance
 Should We Worry About Safety Insurance Group, Inc.’s (NASDAQ:SAFT) P/E Ratio?

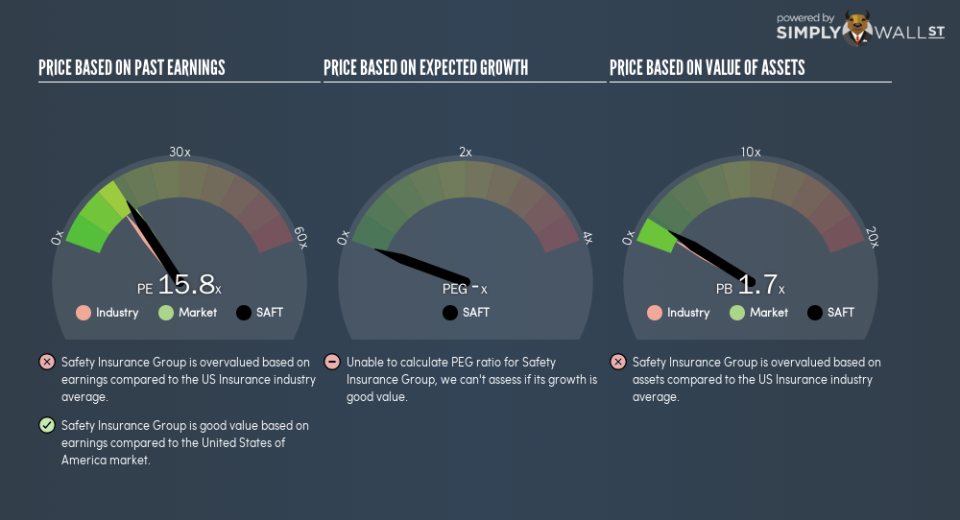
This article is for investors who would like to improve their understanding of price to earnings ratios (P/E ratios). We’ll show how you can use Safety Insurance Group, Inc.’s (NASDAQ:SAFT) P/E ratio to inform your assessment of the investment opportunity. Based on the last twelve months, Safety Insurance Group’s P/E ratio is 15.84. In other words, at today’s prices, investors are paying $15.84 for every $1 in prior year profit.
Check out our latest analysis for Safety Insurance Group
Want to help shape the future of investing tools and platforms? Take the survey and be part of one of the most advanced studies of stock market investors to date.
How Do You Calculate A P/E Ratio?
The formula for P/E is:
Price to Earnings Ratio = Share Price ÷ Earnings per Share (EPS)
Or for Safety Insurance Group:
P/E of 15.84 = $79.59 ÷ $5.03 (Based on the trailing twelve months to September 2018.)
Is A High Price-to-Earnings Ratio Good?
A higher P/E ratio means that investors are paying a higher price for each $1 of company earnings. That isn’t a good or a bad thing on its own, but a high P/E means that buyers have a higher opinion of the business’s prospects, relative to stocks with a lower P/E.
How Growth Rates Impact P/E Ratios
Probably the most important factor in determining what P/E a company trades on is the earnings growth. When earnings grow, the ‘E’ increases, over time. That means unless the share price increases, the P/E will reduce in a few years. So while a stock may look expensive based on past earnings, it could be cheap based on future earnings.
Safety Insurance Group increased earnings per share by an impressive 20% over the last twelve months. And earnings per share have improved by 9.4% annually, over the last five years. This could arguably justify a relatively high P/E ratio.
How Does Safety Insurance Group’s P/E Ratio Compare To Its Peers?
The P/E ratio essentially measures market expectations of a company. The image below shows that Safety Insurance Group has a higher P/E than the average (13.7) P/E for companies in the insurance industry.
Its relatively high P/E ratio indicates that Safety Insurance Group shareholders think it will perform better than other companies in its industry classification. The market is optimistic about the future, but that doesn’t guarantee future growth. So further research is always essential. I often monitor director buying and selling.
Remember: P/E Ratios Don’t Consider The Balance Sheet
It’s important to note that the P/E ratio considers the market capitalization, not the enterprise value. In other words, it does not consider any debt or cash that the company may have on the balance sheet. In theory, a company can lower its future P/E ratio by using cash or debt to invest in growth.
Such spending might be good or bad, overall, but the key point here is that you need to look at debt to understand the P/E ratio in context.
Is Debt Impacting Safety Insurance Group’s P/E?
Safety Insurance Group has net cash of US$51m. That should lead to a higher P/E than if it did have debt, because its strong balance sheets gives it more options.
The Bottom Line On Safety Insurance Group’s P/E Ratio
Safety Insurance Group’s P/E is 15.8 which is about average (16.8) in the US market. With a strong balance sheet combined with recent growth, the P/E implies the market is quite pessimistic.
Investors should be looking to buy stocks that the market is wrong about. If the reality for a company is not as bad as the P/E ratio indicates, then the share price should increase as the market realizes this. Although we don’t have analyst forecasts, you could get a better understanding of its growth by checking out this more detailed historical graph of earnings, revenue and cash flow.
But note: Safety Insurance Group may not be the best stock to buy. So take a peek at this free list of interesting companies with strong recent earnings growth (and a P/E ratio below 20).
To help readers see past the short term volatility of the financial market, we aim to bring you a long-term focused research analysis purely driven by fundamental data. Note that our analysis does not factor in the latest price-sensitive company announcements.
The author is an independent contributor and at the time of publication had no position in the stocks mentioned. For errors that warrant correction please contact the editor at editorial-team@simplywallst.com.
