
 Yahoo Finance
 Should We Worry About Home Capital Group Inc.'s (TSE:HCG) P/E Ratio?

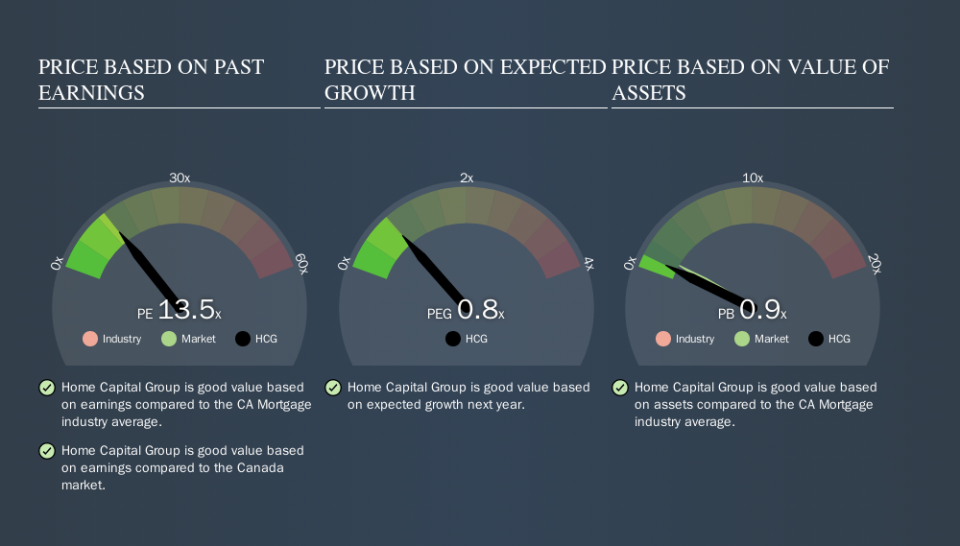
This article is for investors who would like to improve their understanding of price to earnings ratios (P/E ratios). We'll show how you can use Home Capital Group Inc.'s (TSE:HCG) P/E ratio to inform your assessment of the investment opportunity. Home Capital Group has a price to earnings ratio of 13.55, based on the last twelve months. That is equivalent to an earnings yield of about 7.4%.
View our latest analysis for Home Capital Group
How Do I Calculate A Price To Earnings Ratio?
The formula for price to earnings is:
Price to Earnings Ratio = Price per Share ÷ Earnings per Share (EPS)
Or for Home Capital Group:
P/E of 13.55 = CA$24.8 ÷ CA$1.83 (Based on the year to June 2019.)
Is A High P/E Ratio Good?
The higher the P/E ratio, the higher the price tag of a business, relative to its trailing earnings. That isn't necessarily good or bad, but a high P/E implies relatively high expectations of what a company can achieve in the future.
How Does Home Capital Group's P/E Ratio Compare To Its Peers?
We can get an indication of market expectations by looking at the P/E ratio. You can see in the image below that the average P/E (13.5) for companies in the mortgage industry is roughly the same as Home Capital Group's P/E.
Its P/E ratio suggests that Home Capital Group shareholders think that in the future it will perform about the same as other companies in its industry classification. The company could surprise by performing better than average, in the future. Further research into factors such as insider buying and selling, could help you form your own view on whether that is likely.
How Growth Rates Impact P/E Ratios
When earnings fall, the 'E' decreases, over time. That means even if the current P/E is low, it will increase over time if the share price stays flat. So while a stock may look cheap based on past earnings, it could be expensive based on future earnings.
Most would be impressed by Home Capital Group earnings growth of 18% in the last year. Unfortunately, earnings per share are down 15% a year, over 5 years.
A Limitation: P/E Ratios Ignore Debt and Cash In The Bank
It's important to note that the P/E ratio considers the market capitalization, not the enterprise value. Thus, the metric does not reflect cash or debt held by the company. In theory, a company can lower its future P/E ratio by using cash or debt to invest in growth.
Such spending might be good or bad, overall, but the key point here is that you need to look at debt to understand the P/E ratio in context.
Is Debt Impacting Home Capital Group's P/E?
Home Capital Group has net debt worth a very significant 143% of its market capitalization. This is a relatively high level of debt, so the stock probably deserves a relatively low P/E ratio. Keep that in mind when comparing it to other companies.
The Bottom Line On Home Capital Group's P/E Ratio
Home Capital Group's P/E is 13.5 which is about average (13.8) in the CA market. While it does have meaningful debt levels, it has also produced strong earnings growth recently. The P/E suggests that the market is not convinced EPS will continue to improve strongly.
Investors have an opportunity when market expectations about a stock are wrong. If it is underestimating a company, investors can make money by buying and holding the shares until the market corrects itself. So this free visual report on analyst forecasts could hold the key to an excellent investment decision.
Of course you might be able to find a better stock than Home Capital Group. So you may wish to see this free collection of other companies that have grown earnings strongly.
We aim to bring you long-term focused research analysis driven by fundamental data. Note that our analysis may not factor in the latest price-sensitive company announcements or qualitative material.
If you spot an error that warrants correction, please contact the editor at editorial-team@simplywallst.com. This article by Simply Wall St is general in nature. It does not constitute a recommendation to buy or sell any stock, and does not take account of your objectives, or your financial situation. Simply Wall St has no position in the stocks mentioned. Thank you for reading.
