
 Yahoo Finance
 Should We Worry About Fidelity National Information Services, Inc.'s (NYSE:FIS) P/E Ratio?

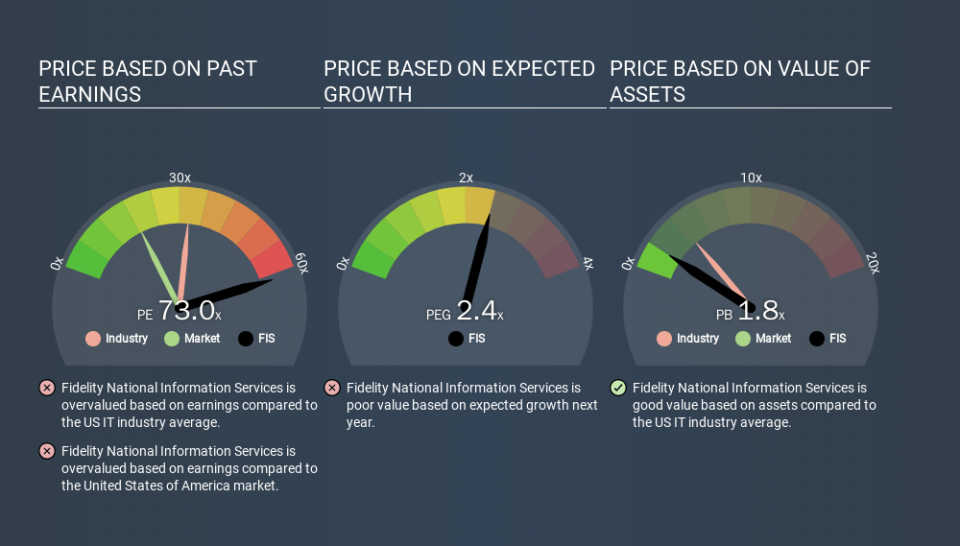
This article is for investors who would like to improve their understanding of price to earnings ratios (P/E ratios). We'll apply a basic P/E ratio analysis to Fidelity National Information Services, Inc.'s (NYSE:FIS), to help you decide if the stock is worth further research. Based on the last twelve months, Fidelity National Information Services's P/E ratio is 73.03. That corresponds to an earnings yield of approximately 1.4%.
Check out our latest analysis for Fidelity National Information Services
How Do You Calculate Fidelity National Information Services's P/E Ratio?
The formula for P/E is:
Price to Earnings Ratio = Share Price ÷ Earnings per Share (EPS)
Or for Fidelity National Information Services:
P/E of 73.03 = USD147.92 ÷ USD2.03 (Based on the trailing twelve months to September 2019.)
Is A High Price-to-Earnings Ratio Good?
The higher the P/E ratio, the higher the price tag of a business, relative to its trailing earnings. That isn't necessarily good or bad, but a high P/E implies relatively high expectations of what a company can achieve in the future.
How Does Fidelity National Information Services's P/E Ratio Compare To Its Peers?
The P/E ratio essentially measures market expectations of a company. As you can see below, Fidelity National Information Services has a higher P/E than the average company (32.5) in the it industry.
Its relatively high P/E ratio indicates that Fidelity National Information Services shareholders think it will perform better than other companies in its industry classification. Shareholders are clearly optimistic, but the future is always uncertain. So investors should delve deeper. I like to check if company insiders have been buying or selling.
How Growth Rates Impact P/E Ratios
Generally speaking the rate of earnings growth has a profound impact on a company's P/E multiple. Earnings growth means that in the future the 'E' will be higher. Therefore, even if you pay a high multiple of earnings now, that multiple will become lower in the future. A lower P/E should indicate the stock is cheap relative to others -- and that may attract buyers.
Fidelity National Information Services's earnings per share fell by 55% in the last twelve months. But over the longer term (3 years), earnings per share have increased by 11%.
Remember: P/E Ratios Don't Consider The Balance Sheet
One drawback of using a P/E ratio is that it considers market capitalization, but not the balance sheet. In other words, it does not consider any debt or cash that the company may have on the balance sheet. Theoretically, a business can improve its earnings (and produce a lower P/E in the future) by investing in growth. That means taking on debt (or spending its cash).
Such expenditure might be good or bad, in the long term, but the point here is that the balance sheet is not reflected by this ratio.
So What Does Fidelity National Information Services's Balance Sheet Tell Us?
Net debt totals 21% of Fidelity National Information Services's market cap. It would probably deserve a higher P/E ratio if it was net cash, since it would have more options for growth.
The Verdict On Fidelity National Information Services's P/E Ratio
Fidelity National Information Services's P/E is 73.0 which suggests the market is more focussed on the future opportunity rather than the current level of earnings. With a bit of debt, but a lack of recent growth, it's safe to say the market is expecting improved profit performance from the company, in the next few years.
Investors should be looking to buy stocks that the market is wrong about. If the reality for a company is better than it expects, you can make money by buying and holding for the long term. So this free report on the analyst consensus forecasts could help you make a master move on this stock.
Of course you might be able to find a better stock than Fidelity National Information Services. So you may wish to see this free collection of other companies that have grown earnings strongly.
If you spot an error that warrants correction, please contact the editor at editorial-team@simplywallst.com. This article by Simply Wall St is general in nature. It does not constitute a recommendation to buy or sell any stock, and does not take account of your objectives, or your financial situation. Simply Wall St has no position in the stocks mentioned.
We aim to bring you long-term focused research analysis driven by fundamental data. Note that our analysis may not factor in the latest price-sensitive company announcements or qualitative material. Thank you for reading.
